Lesson 1: Sketching and Interpreting Graphs
Module 4: General Relations
Discover
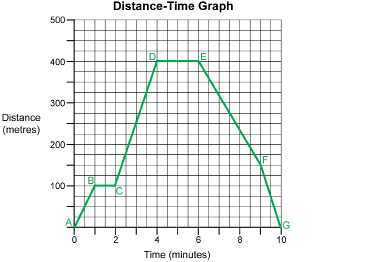
A graph’s properties can provide clues about a particular situation. The properties of a distance-time graph are illustrated in the following graph, which shows the progress of a person’s hike.

© Brian Goodman/shutterstock
 Try This 1 - 9
Answer the following questions based on the distance-time graph above.
Complete the following in your course folder ( binder).
TT 1. How long does it take to get from point A to point B?
TT 2. How far is it from point A to point B?
TT 3. How fast is the person moving from point A to point B in metres per second?
TT 4. How long does it take to get from point B to point C?
TT 5. How far is it from point B to point C?
TT 6. What is happening during the time that the person is moving from point B to point C?
TT 7. How fast is the person moving from point C to point D in metres per second?
TT 8. How far away is the person from the start point once he or she has reached point G?
TT 9. How many metres has the person hiked during the entire trip?
Check your answers by using the provided answers below.
Possible TT1 - 9 (Try This 1 - 9) Answers