Lesson 4: Slope
Module 4: General Relations
Connect
![]() Lesson Assessment
Lesson Assessment
Complete the lesson quiz posted under the Assess tab or by using the Quizzes link under the Activities block. Also, ensure your work in your binder (course folder) is complete.
 Project Connection ** NOT ASSIGNED**
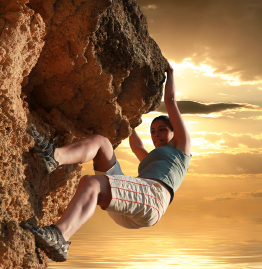
© Vladimir Nikulin/shutterstock
There are numerous sporting events that rely on slope. Rock climbing and bobsled racing are two of those sporting events.
In the Lesson 4 component of the Unit 3 Project, you will be required to choose a sporting event that includes slope in some way.
First, you will be required to provide a graph and a description of when you would have each of the following situations:
-
a positive slope
-
a negative slope
-
a slope of 0
-
an undefined slope
For each of the four situations, you will provide two points on your graph and show the rise/run slope calculation.
Next, you will be required to perform an Internet search to find out about slope as an aspect of design. Report on an area of interest where the construction of a particular slope is critical to the purpose of an event or activity. For example, you may want to find out about how the design of a ski-jumping hill facilitates safe landings. You may venture outside the realm of sports and consider the design of such things as the slope of the landing strip for a space shuttle.
The following is a sample project.
Event: Mountain Biking
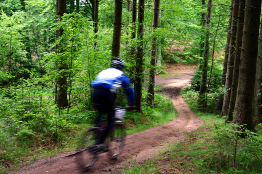
© jean schweitzer/shutterstock
- Provide a graph and a description of when you would have each of the following.
- a positive slope
As the bike rider is climbing the hill (or riding the chairlift), this would represent a positive slope. The graph shows the bike rider starting at 100 ft above sea level and reaching a height of 700 ft after 24 min.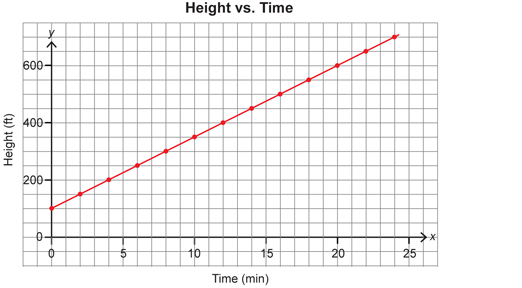
Two points on this graph include (0, 100) and (10, 350).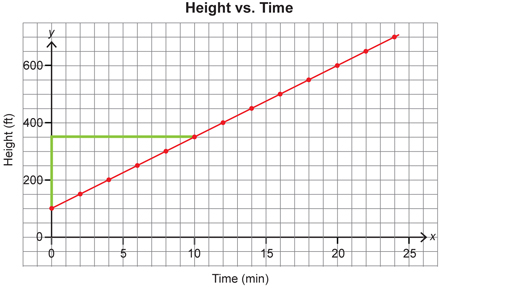
- a negative slope
The mountain biker is now at the top of the hill, at 700 ft, and the trail takes the rider down the other side of the hill, with a steeper slope. The rider is descending the hill and the graph slopes from left to right, so this shows a negative slope.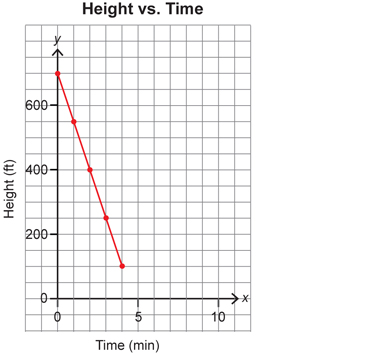
Two points on this graph include (0, 700) and (2, 400).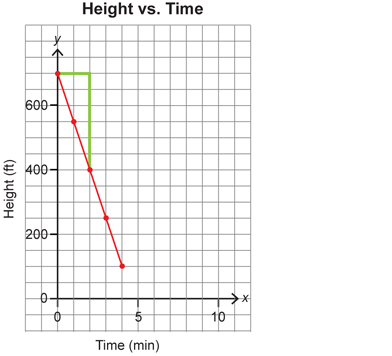
- a slope of 0
When the mountain biker reaches the bottom of the trail at 100 ft, the biker can then ride around the hill to the chairlift, which is also at 100 ft above sea level. This ride from one side of the hill to the other has no elevation change and, therefore, no slope.
Two points on this graph include (0, 100) and (6, 100).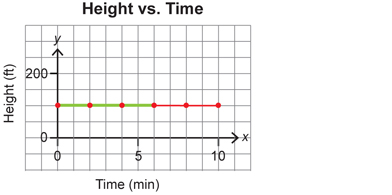
- an undefined slope
In this example, it does not work to have a vertical line. This would mean that time stands still (since time is along the x-axis). You would need to have a change in distance without a change in time.
If you graphed this impossible situation, the graph would look like this.
Two points on this graph include (0, 0) and (0, 20).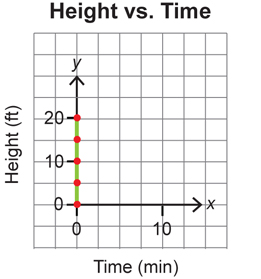
The slope is undefined, as you cannot divide by zero.
At this time, go to the multimedia DVD and open the “Unit 3 Project.”
 Going Beyond
© abstrand/shutterstock
© Chepe Nicoli/shutterstock
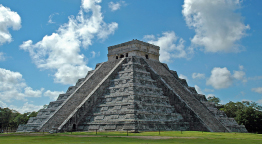
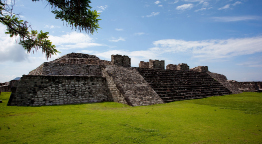
In the Discover section of this lesson you completed a Math Lab based on the rise and run of stairs. The use of stairs is an ancient innovation used by the Mayan, Aztec, and Inca civilizations. Choose a step pyramid from one of these civilizations to investigate. You may find the Pyramids of Mesoamerica website helpful. Go to a search engine and type the keywords “pyramid Mesoamerica.”
The history of the pyramids provides a little insight into the cultures that created them. Research the history of your chosen pyramid, and see if you can find the measurements of the stairs.
- If the steps of a typical pre-Columbian period are 9 in high and 6 in wide, how does the slope of these stairs compare to the slope of modern stairs?
- Why would the stairs on an Aztec pyramid be steeper than those found in a current building?