Lesson 2: Properties of Linear Functions
Module 5: Linear Functions
Explore

© jon11/8024049/Fotolia
The triathlon is a challenging sport that combines three races into one: swimming, cycling, and running. The triathlon debuted at the 2000 Summer Olympics in Sydney, Australia. The race is grueling, and an athlete needs to be well conditioned in order to perform at the highest levels. The competitor with the fastest combined speed wins the event.
The progress of an athlete through a particular phase of a triathlon can be represented by a distance-time graph. This graph could be closely approximated by a linear function.
Glossary Terms
Add the following terms to your Glossary Terms" section in your notes, including definitions and examples as needed.
- linear function
- x-intercept
- y-intercept
----------------------------------------------------------------------------------------------------------------
A GRAPH OF A LINEAR FUNCTION
The graph of a linear function can be described by its properties. These properties include slope, intercepts, domain, and range. As you have seen from the linear functions you have sketched or graphed, their location on the coordinate plane and slope make each function unique.
The intercepts of any relation are the points where the graph of the relation crosses the x-axis or the y-axis. Where a graph crosses the x-axis, the point of intersection is called the x-intercept. Likewise, where a graph crosses the y-axis, the point of intersection is called the y-intercept.
![]() Try This 1 - 4
Try This 1 - 4
Print (or complete by hand) and complete the following in your course folder binder.
Use the link below to check your answers to Try This 1 - 4.
![]() Share 1 - 7
Share 1 - 7
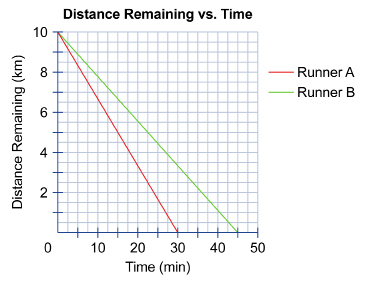
Study the following distance-time graph showing the progress of two non-Olympic athletes through the 10-km running portion of a triathlon.
Complete these questions in your course folder (binder) and use the link provided to check your work.
1. How is this graph different from other distance-time graphs you have seen previously?
2. Who is the faster runner? How do you know?
3. After 15 minutes, how much farther does each runner have to run in order to complete the race?
4. How is the graph for Runner A similar to the graph for Runner B?
5. Express the y-intercept of each graph as an ordered pair. What is the meaning of each element of the ordered pair in this context?
6. Express the x-intercept of each graph as an ordered pair. What is the meaning of each element of the ordered pair in this context?
7. a. Is it possible to sketch a different line with the same slope as the red line?
b. Is it possible to sketch a different line with the same intercepts as the red line?
----------------------------------------------------------------------
You may have learned in the Discover section that a linear relation can have one, two, or infinitely many intercepts.
Compare the following examples with your own sketches. Some of the examples may be identical to your own graphs, whereas others may not be identical. As you study the examples, see if you can determine for which ones there must be only one way to sketch the graph.
Example
Sketch two graphs for each of the following conditions.
-
two intercepts
-
one intercept only
-
infinitely many intercepts
In each case, state the intercepts as ordered pairs.
Solution
-
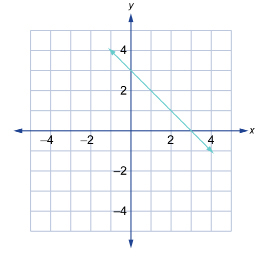
Graphs with two intercepts.
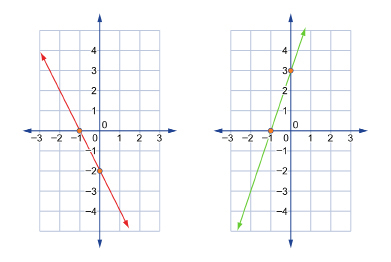
The red line on the graph to the left passes through x-intercept (-1, 0) and y-intercept (0, −2)
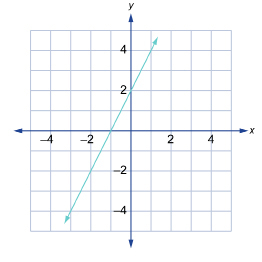
The green line on the graph to the right also passes through x-intercept (-1, 0) but passes through a different y-intercept of (0, 3). - Graphs with only one intercept.

The red horizontal line passes through the y-intercept of (0, 3), and the green vertical line passes through the x-intercept (0, −1). - Graphs with infinitely many intercepts.
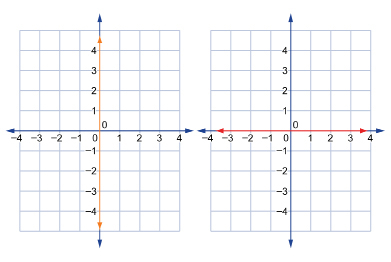
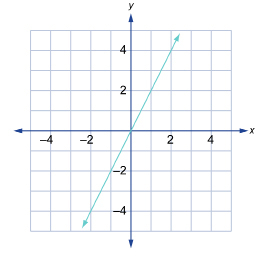
Since the vertical line graphed on the left is also the y-axis, the graph has infinitely many y-intercepts. In other words, every point along the y-axis is a y-intercept of this line.
Since the horizontal line graphed on the right is also the x-axis, the graph has infinitely many x-intercepts. In other words, every point along the x-axis is an x-intercept of this line.
Did You Know?
You can state the intercepts of graphs as values, as well as ordered pairs. For example, the y-intercept (0, 3) can also be stated as y-intercept = 3. Similarly, the x-intercept (2, 0) can also be stated as x-intercept = 2. In both cases, it is understood that the coordinate that is not stated is 0.
![]() Self-Check
Self-Check
SC 1. For each of the following graphs, write the x- and the y-intercepts in the form of an ordered pair. Assume that the scale along each axis is 1 unit.