Lesson 2: Properties of Linear Functions
Module 5: Linear Functions
Connect![]() Lesson Assessment
Lesson Assessment
Complete the lesson quiz posted under the Quizzes link to the left in moodle or under the Assess tab and ensure your work in your binder (course folder) is complete.
 Project Connection ** NOT ASSIGNED**

Jupiterimages/Brand X Pictures/Thinkstock
In your last lesson you researched and began to analyze linear data. This data may have been related to the Olympics. In this lesson you will use the same data that you already have: a table of values, a graph, or an equation. You will use that information to answer questions.
Go to the Unit 3 Project and complete the Module 5: Lesson 2 component of the project.
 Going Beyond
left: © aberenyi/14545323/Fotolia; right: © William Attard McCarthy/shutterstock
There are many factors to consider when you are planning to buy a new car. These include safety, comfort, style, handling, and fuel consumption. For many people, fuel consumption is one of the most important factors. Graphs of linear functions can be used to assist consumers in their vehicle purchases.
Study the following graph, which compares the fuel consumption of a Smart car to that of a Volvo.
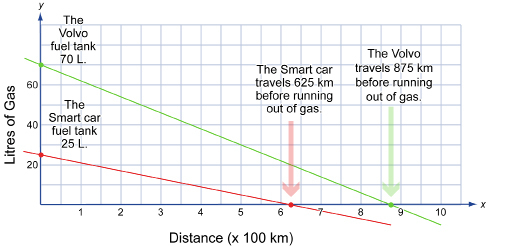
Notice the information you can gain from looking at the intercepts on the graph.
-
What title would you give to this graph?
-
Do you think you could find the equation of the green line (the Volvo) and the red line (the Smart car)?
-
What do you think the slopes of the blue line and the green line represent?