Lesson 3: Slope Intercept Form
Created by IMSreader
Module 5: Linear Functions
Using Linear Functions to Model a ProblemWhen a linear function is used to model a problem in a particular context, there may be some limits to the properties of the function. These limits or restrictions may be placed on such properties as the independent and dependent variables, domain and range, and slope and y-intercepts.
Example
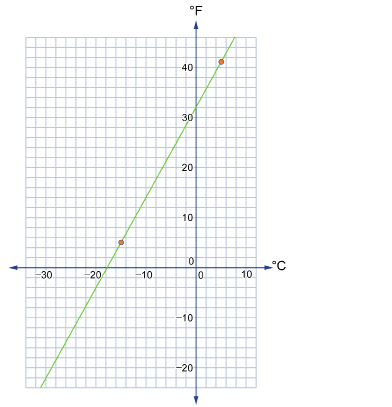
Amarjeet and Kristin are snowboarding at Lake Louise. Kristin moved from the United States, so she is accustomed to temperatures reported in Fahrenheit, but Amarjeet is from Alberta, so he is more familiar with the Celsius scale. They decide to graph the relationship between the two temperature scales based on their day at Lake Louise. In the morning, Amarjeet recorded the lowest temperature reached to be a chilly −15°C. By late afternoon, he recorded the highest temperature to be 5°C. At the same times of the day, Kristin recorded the lowest temperature to be 5°F and the highest temperature to be 41°F.
-
Identify the independent and dependent variables.
-
State the domain and the range of the temperatures experienced this day by the snowboarders.
-
Calculate the slope of the graph. What does this value represent?
-
State the y-intercept of the graph. What does this value represent?
-
State the equation of the graph in slope-intercept form.
Solution
-
The independent variable is Celsius. The dependent variable is Fahrenheit.
-
For this particular day, the domain is
 and the range is
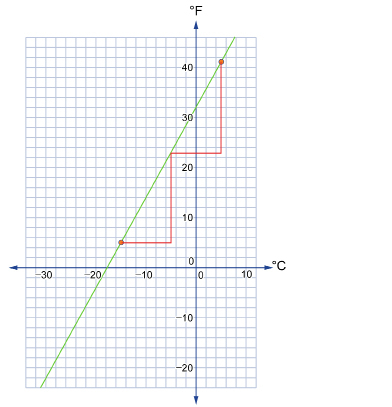
- To determine slope from a graph, you can choose two points and do either of the following:
- Apply the coordinates to the slope formula.
- Count the rise and the run between the points.
The slope is This means that for every 9° change in Fahrenheit, there is a corresponding change of 5° in Celsius.
You can also determine the slope by using the method, as shown in the following graph.
- The y-intercept is (0, 32). This means that 0°C is equal to 32°F.
- The equation of the graph is

Did You Know?
If you travel in the United States in the summer time, you may encounter temperatures approaching 100°F! You can use the following algorithm to obtain an approximation of the temperature in degrees Celsius:
Step 1: Subtract 30 from the Fahrenheit temperature.
Step 2: Divide the result by 2.
To estimate the temperature 100°F, mentally subtract 30°F to get 70°F. Then divide 70°F by 2 to get 35°C. (The actual temperature is 37.8°C.)
This is an algorithm you can perform mentally, and it gives a reasonable approximation!
Linear functions are represented by lines that extend infinitely in both directions. However, when a linear function is used to model a specific situation or context, there are often limitations on how far a line extends. In some cases, it does not make sense for the line to extend into quadrants where there are negative points. In other cases, the points on a line may not have any meaning beyond a certain value.
 Self-Check
In the following Self-Check, you will work with graphs of linear functions that are both unrestricted and restricted. Unrestricted graphs are those that extend infinitely. They are not associated with a particular context. Restricted graphs, on the other hand, are limited by the conditions of the situation.
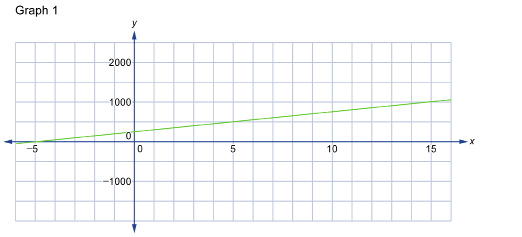
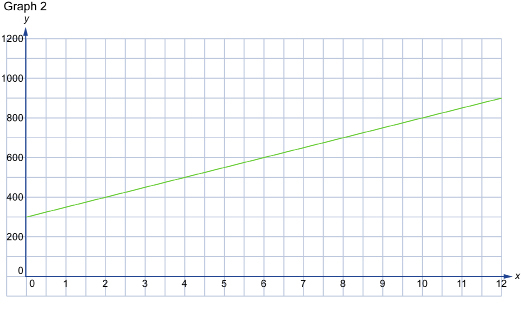
SC 3. Complete the table in Restricted Graph and Unrestricted Graph based on the graphs that follow. You need the following information to complete the table.
-
Graph 1 is an unrestricted graph.
-
Graph 2 is a restricted graph based on the following situation: the monthly cost, over a 12-month period, of owning and using a cellphone if the phone costs $300 to purchase and the basic plan is $50 per month (assuming a person stays within the plan and doesn’t add on extra charges).
SC 4. You have decided to help out with some school fundraising for an upcoming trip to California. You decided to bake some healthy granola bars to sell, and you want to make at least $5 for every $1 you spend on supplies.
-
You have $25 dollars that you can spend on supplies. Create a table of values showing your expenses and your minimum profit for the first $25 you spend. (You can count up by $5 purchases.)
-
Determine the dependent and the independent variables.
-
Graph your data.
-
Determine the y-intercept.
-
What does the y-intercept represent?
-
Calculate the slope.
-
What does the slope represent?
-
Determine the domain and the range for your graph.
 Try This 4
Complete the following questions from your textbook in your course folder ( binder).
Foundations and Pre-calculus Mathematics 10 (Pearson)
TT4: Complete “Exercises” question 13 on page 363.
Use the link below to check your answers to Try This 4.