Lesson 5: Graphing Linear Functions
Created by IMSreader
Module 5: Linear Functions
Explore

Janis Litavnieks/iStockphoto/Thinkstock
There are many forms of martial arts, such as tae kwon do, karate, or Muay Thai boxing.
Tae kwon do, a martial art with origins in Korea, is an official Olympic discipline. Like any other combative sport, tae kwon do consists of both offensive and defensive tactics that enable competitors to score points in competition.
There are different types of strikes that are allowed, and some competitors may favour a particular kind of strike when competing. Nevertheless, the successful tae kwon do competitor will employ a variety of different strikes and blocks to overcome his or her opponent. Each manoeuvre is chosen based on the circumstances of the moment. Likewise, in this lesson you will explore a variety of strategies to graph linear functions.
In this lesson you will examine different ways of graphing a linear function based on the form of its equation. A linear relation is a relation whose graph is represented by points along a straight line. On the other hand, a non-linear relation is a relation whose graph is not represented by a straight line.
To graph a line, you need to know one of the following:
-
two points on the line
-
one point on the line and the slope
In the following activities you will learn how to extract the information you need from the form of the equation. The forms you will investigate are the slope-intercept form, the slope-point form, and the general form.
As you proceed through this lesson, you will be required to complete a summary sheet of the techniques and strategies for graphing linear functions. This summary sheet will help you to consolidate your learning. The sheet can also be used as a tool to help you review and prepare for tests or quizzes.
Save a copy (or copy by hand) the Graphing Linear Functions: Summary of Strategies document to your course folder now. A description of how to use the document is included.
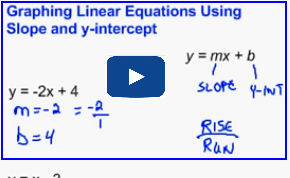
Slope-Intercept Form (y = mx + b)
 Watch and Listen
Watch the video “Graphing from Slope Intercept form”. Focus on how the slope is applied to find the second point.
----------------------------------------------------------------------
 Tip
Tip
You can use a graphing calculator to check that you have sketched a graph properly. Enter the equation into the graphing editor. Most calculators will only accept an equation in the form “Y =”. Set an appropriate window and then graph the function. Compare your sketch to the one displayed on your calculator. Many graphing calculators will also have the option of checking specific points on the graph so you can be more confident that your sketch and the one on the calculator are identical.
 Self-Check
Now it is your turn to graph a linear relation expressed in slope-intercept form. Check your answers as you proceed.
SC 1. Consider the linear function ![]()
-
What is the slope?
-
Provide the coordinates of one point on the graph.
-
Use the information in SC 1.a. and SC 1.b. to sketch the graph. Describe the procedure you followed to sketch the graph.
-
Check your answer by using graphing display technology, such as a graphing calculator or graphing software.
Retrieve your Graphing Linear Functions: Summary of Strategies document that you saved to your course folder, and update it with your strategy for graphing based on slope-intercept form.
-----------------------------------------------------------------------------------------------------------------------------------------
Slope-Point Form
Recall that the slope-point form of the equation of a linear function is given by y − y1 = m(x − x1), where m is the slope and (x1, y1) is a point on the graph.
Graphing a linear function expressed in slope-point form is similar to graphing one expressed in slope-intercept form. In this case you will be applying the slope to a point other than to the y-intercept. This is mathematically sound since the slope of a line is constant between any two points.
Tip
With a slope-point equation, you have this form:y − y1 = m(x − x1)
To find a point on the graph, look at the (x1, y1) values. In other words, look at what is being subtracted from the x and y variables. In this case, y − 4 = 3(x − 2) shows that the 2 and the 4 are being subtracted. Therefore, a point on the graph is (2, 4).
If the equation is y + 4 = 3(x + 2), then you can rewrite it as y − (−4) = 3[x − (−2)]. This means that a point on this graph is (−2, −4).
Self-Check
Apply your knowledge of graphing linear functions to the following question. If you are stuck on any part of the problem, there are a couple of hints you can review to help you solve the question.
SC 2. Sketch the linear function y − 4 = 3(x − 2). Describe your reasoning and the procedure you followed. Check your answer by using graphing display technology, such as a graphing calculator or graphing software. Note: If you are stuck on any part of the problem, click on Finding a Point or Finding a Slope to help you answer this question.
Tip
If you have a point at the top area of your graph, and it is inconvenient to find a point higher on your graph, there is an alternate way to find a second point.
A slope of 3 is equal to ![]() or
or ![]() .
.
This implies that a second point can be found 3 units below and 1 unit left of the first point. You will obtain the same line whether you use this point or one that is above and to the right. Try it for yourself!
Your strategy for graphing may have been different than those presented in the suggested answer for SC 2; but the underlying principles are the same for any strategy. Make any necessary revisions to your sketch, and record any misconceptions that you may have had.
Retrieve the Graphing Linear Functions: Summary of Strategies document from your course folder, and record any new strategies that you have learned or any previously learned strategies that were reinforced. Remember to save your updated Graphing Linear Functions: Summary of Strategies document to your course folder (binder).
--------------------------------------------------------------------------------------------------------------------------------------------------
General Form
In the Discover section of this lesson, you investigated how you can extract a slope and points from the equation of a linear function in general form.
Retrieve your results from Math Lab: Analyzing General Form. In Part A, you rearranged equations given in general form to equations in slope-intercept form. You can do this also in the general case:
The slope is ![]() , and the y-intercept is
, and the y-intercept is ![]() .
.
Compare this final result to your response to question 3 from Part A. Did you arrive at the same conclusion? You may want to add any new knowledge that you may have gained to your answers in the Math Lab. Without erasing your initial response, revise your response by adding to it or noting errors in your thinking.