Lesson 1: Solving Linear Systems by Graphing
Module 7: Systems of Linear Equations
 Watch and Listen
To watch a video about "Solving systems of equations".

Watch the video from the beginning to 3:30 to see how you can model a situation with a system of linear equations. The video will also show you how you can solve the system by graphing. As you watch the video, pay attention to how the graph can be used to make decisions related to the original problem.
 Share 5 - 7
Discuss the following questions with a partner ( if possible)
5. Verify the solution to the system of equations in the previous Share activity, according to the example shown in your textbook.
6. When verifying, which values are used? Why are these values placed into the original equations of the linear system?
7. Under what circumstances would it be inefficient to use a graphing method to determine the solution to a system of equations?
Use the provided link to check your work.
Possible S 5 - 7 Solutions
Verifying Solutions
Example 1. For which of these systems is (3, –2) a solution? Do not graph the systems. Use verifying techniques to check each system.
A. x + 2y = -1
2x - y = 4
B. 2x + 3y = 0
x - y = 5
C. 2x + y = 8
3x - 4y = 14
Solution 1. We substitute 3 into each x coordinate, -2 into each y coordinate and then check to ensure both sides come out to be the same number.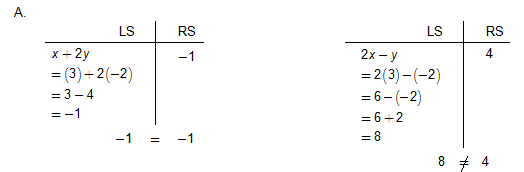
(3, –2) is not the solution to this system because it does not satisfy the second equation in the system.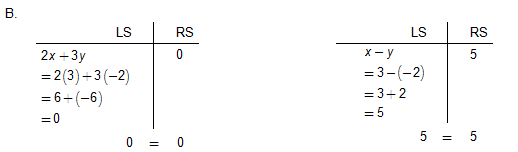
Since both equations are verified, (3, –2) is the solution to this system.
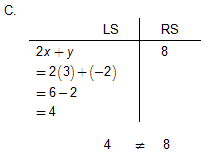
(3, –2) is not the solution to this system because it does not satisfy the second equation in the system.
NOTE: It is necessary to check both equations to make sure the point works in both equations. The exception is if the point does not work in the first equation, we would know that the solution does not work.
Watch and Listen
For an in depth summary of the content in the lesson to date, use the link below. She goes through all the major concepts.
"Solving Linear Systems by Graphing".

------------------------------
It is not always possible to obtain an exact solution when using the graphing method used to date. The following Try This activity shows a case where the graphing method may yield an ambiguous result.
 Try This 11
Solve the following system of equations by graphing. Use your own graph paper or the Graph Paper Template to complete this question.
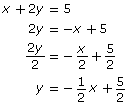
x + 2y = 5
3x - 2y = 9
Possible TT 11 ( Try This 11) Solution
You may have noticed that the x-value and the y-value in the solution are not integers. As a result, it may have been difficult for you to identify the solution accurately.
------------------------------
Study the next example to see how you can use graphing technology to obtain a more precise solution.
Finding Points of Intersection using Technology
**A hand held graphing calculator is REQUIRED here **
Example 2
Use graphing technology to solve the following system of equations.
x + 2y = 5
3x – 2y = 9
Then verify the solution.
Solution 2
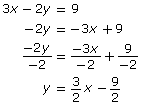
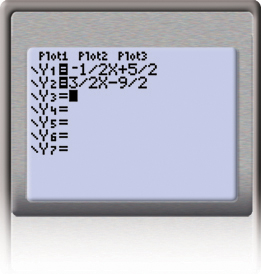
Step 1: Re-arrange each equation into slope-intercept form.
Step 2: Insert the re-arranged equations into your graphing calculator. Find the y= button on the top left. Use the x, T, θ, n button to put the x into the display and the (-) button to put in the negative in front of the 1/2x and the - (subtraction) button to put in the 9/2.
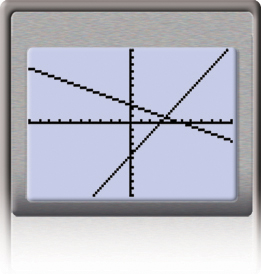
Step 3: Graph the equations. Hit graph ( button on the top right).
 Tip
Tip
For some systems, you may not be able to see the graphs when you press the “Graph” key because the window settings are not suitable. To remedy this, you can access the window settings of the graphing calculator to adjust your display. (Hit the window button - top middle). You will want to set your window so that you can see where the two lines intersect.
Step 4: Use the features of the graphing calculator or graphing software to determine the point of intersection. Do the following:
i. 2nd Trace to get to the Calc screen
ii. Choose option 5 - hit enter.
iii. Use the left and right arrow keys to make sure the cursor is on one of the curves to the LEFT of the intersection point. (it does not have to be that close to the point) Hit enter.
iv. Repeat step iii for the second curve. Hit enter.
v. Hit enter one more time and it will give you the final point of intersection.
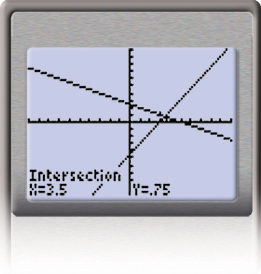
Step 5: You can verify the solution by substituting x = 3.5 and y = 0.75 into the original equations
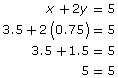
Since both equations are satisfied, the solution to the linear system is (3.5, 0.75).
Systems of equations are helpful in solving problems where there are multiple unknown variables. As long as there is enough information, a solution or even multiple solutions can be found.
Watch and Listen
For an in depth summary of the of how to use the graphing calculator to find a point of intersection, use the link below.
"Solving Linear Systems by Graphing on a Graphing Calculator".

------------------------------
Modelling Problems Using Systems of Equations
The next Try This activity gives an example of a problem that can be modeled by a system of linear equations.
Try This 12 - 15
Kendra operates a mobile hot dog stand at a local week-long summer festival. Her cost to run the hot dog stand includes $1200 to rent the cart and $1 per hot dog. She charges her customers $2.50 for each hot dog. A system of equations that represents this scenario is given by
d = x + 1200
d = 2.5x
The variable d is dollars and the variable x is the number of hot dogs.
Complete the following questions in your binder. You NEED a graphing calculator here.
Try This 12 - 15 Questions
Use the link below to check your answers to Try This 12 - 15.
Possible TT 12-15 Solutions
The situation presented in TT 12 to TT 15 shows that there are two linear relationships that apply to a situation, but by solving them you identify where they intersect and whether they relate to each other. In this Try This activity, the solution is the point where cost and revenue are equal.
 Read
Read
Go to your textbook and work through an example showing how you can model a problem with a linear system and solve it by graphing.
Foundations and Pre-calculus Mathematics 10 (Pearson)
Read “Example 2: Solving a Problem by Graphing a Linear System” on pages 406 and 407. Why are the equations of the linear system set up the way they are? What can you learn about the way this system is written that can help you when you encounter similar problems later in this module?
Try This 16
Complete the following in your course folder ( binder).
Foundations and Pre-calculus Mathematics 10 (Pearson)
TT 21. Complete “Exercises” questions 3, 4, 5, 6, and 8 on page 409.
Use the link below to check your answers to Try This 16.
Possible TT 16 Solutions