Lesson 1: Solving Linear Systems by Graphing
Module 7: Systems of Linear Equations
Connect
You may find it helpful to fill in a chart, like the one linked below, to help you summarize the strategies you learn throughout the module.
Solving Linear Systems Strategies Table
 Lesson Assessment
Complete the lesson quiz posted under the Quizzes link to the left in moodle or under the Assess tab and ensure your work in your binder (course folder) is complete.
 Project Connection **NOT ASSIGNED**

© Prod. Numérik/12074798/Fotolia
Imagine you and a group of friends have decided to go on a trip. To help cover the costs of the trip, you and your friends have decided to do fundraising. First, your group plans to conduct a bottle drive in the community. Next, the group will buy a lawn mower and do yard work to raise money.
Go to the Unit 4 Project and complete the Module 7: Lesson 1 component of the project to answer questions about your fundraising projects.
![]() Going Beyond
Going Beyond
In this lesson you used graphing methods to solve systems of equations in two variables. Systems of equations can have more than two variables. For example, the following system contains three equations involving three variables:
x + y + z = 6
2x – y + z = 3
x + y – z = 0
Notice that in addition to the x and y, a third variable, z, has been introduced. It may be difficult for you to guess the values of x, y, and z that would satisfy this system. Fortunately, there are different methods for solving this system. How would you solve this system by graphing?
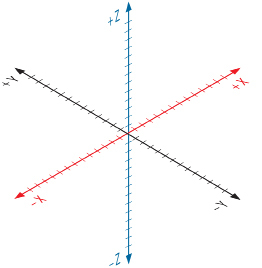
To graph points on a two-dimensional coordinate plane, you are accustomed to plotting ordered pairs (x, y). To graph points on a three-dimensional coordinate plane, like the one shown in the diagram, you need to plot ordered triples (x, y, z). The third axis, called the z-axis, rises up through the origin.
- Print a copy of the 3-D Coordinate Plane. Plot the following points:
- (3, 3, 3)
- (–2, 5,–8)
- (0, 10, 4)
- Follow the steps below to construct the graph of the equation 3x + 2y – z = 12.
- Find the x-intercept by substituting y = 0 and z = 0 into the equation.
- Find the y-intercept and z-intercept by using a similar method as in 2.a.
- Plot the three intercepts.
- Connect each intercept to the other with a line segment to form a triangle. This is the partial graph of 3x + 2y – z = 12.
- Use the Internet to search “online 3-D grapher” to find an applet that can help you visualize the graphs of equations in three variables. Once you find a suitable applet, enter each equation of the system found at the beginning of this section to see what their graphs look like. If the applet allows you to graph multiple equations on the same set of axes, you may be able to find the solution to the system!
Solving a system of equations in three variables by graphing is impractical without specialized software to help you visualize the solution. You will explore methods for solving such systems in subsequent Going Beyond sections.
Save your work in your course folder. Your teacher may ask to see them later.