Lesson 1
1. Lesson 1
1.7. Explore
Module 3: Quadratics
Explore
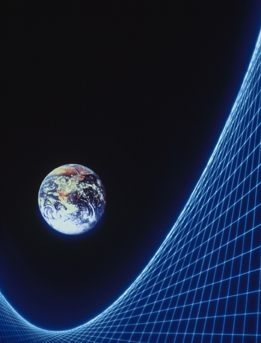
Comstock/Thinkstock
The shape of the graph of a quadratic relation is called a parabola. In the photo, the thickest blue line could also be described as having a parabolic shape. Can you see the similarity between it and the graphs of the quadratic relations you have observed so far in this lesson?
In Try This 1 you discovered how changing the coefficients and constant in a quadratic function written in standard form (y = ax2 + bx + c) can affect the graph of the function. You might have noticed the connection between a and the parabola’s direction:
- When a is positive, the parabolic graph open upwards.
- When a is negative, the graph will open downwards.
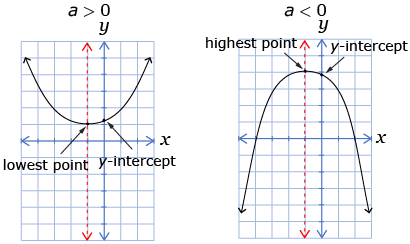
from: CANAVAN-MCGRATH ET AL. Principles of Mathematics 11, © 2012 Nelson Education Limited. p. 323. Reproduced by permission.
Did you notice how changing the value of b changes the location of the parabola’s line of symmetry and that the highest or lowest point on the parabola lies on the vertical line of symmetry? When you left a and b constant and changed the value of c, did you determine that c is actually the value of the parabola’s y-intercept?
You also might have noticed the connection between the value of a and the shape of the graph, specifically the steepness of the opening of the parabola. Changing the value of only a (i.e., b and c are constant) changes the shape of the parabola; however, when you change the value of only b or only c, the shape of the parabola stays the same. Changing only b or only c translates the parabola horizontally or vertically, but the shape of the parabola remains the same.