Lesson 1
Completion requirements
Created by IMSreader
1. Lesson 1
1.8. Explore 2
Module 3: Quadratics
Use Try This 2 to further investigate how changing the value of a affects the steepness of the opening of the parabola when the value of b and c remains constant.
Try This 2
The Quadratic Interactive shows several graphs of quadratic functions. To the right of the graphs, you will see a slider that can be used to change the value of a.
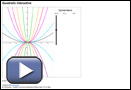
- Starting with slider a at zero, move the slider up until the black graph is hidden by the first light blue curve. Record the value of a. Continue to move the slider up, and record each value of a as the black graph is hidden by each coloured graph. Move the slider back to zero, and repeat by moving the slider downwards.
You might use a chart like the following to save your work.
Graphs Above the x-axis
Colour
light blue
purple
red
yellow
green
a-value
Graphs Below the x-axis
Colour
light blue
purple
red
yellow
green
a-value
- Use your observations to answer the following questions.
- How does the width of the graph change as the value of a changes when compared to y = x2? Describe the patterns you saw.
- Identify two graphs that are identical reflections of each other (i.e., across the x-axis). Explain your choice.
- How does the width of the graph change as the value of a changes when compared to y = x2? Describe the patterns you saw.