Lesson 1
1. Lesson 1
1.11. Lesson 1 Summary
Module 3: Quadratics
Lesson 1 Summary
In this lesson you studied a specific form of the quadratic function called the standard form, y = ax2 + bx + c. A quadratic function has a variable raised to the second power or squared. If there is an exponent higher than 2 in the function, it is not a quadratic function. You learned that the rules for determining whether a given relationship is a function holds true for quadratic relations as well as linear relations. Each input value can have only one output value. Any relation is not a function if the input value has more than one output value. In terms of x and y, each x-value can have only one y-value. However, a y-value can be paired with two or more x-values. The graph of a function must be able to pass the vertical line test, where a vertical line drawn through the graph of the function will not intersect the function in more than one place at any time.
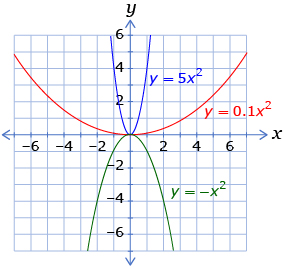
The graph of a quadratic function forms a parabolic shape and has specific characteristics. In the Discover section you were able develop rules about the effect of changing the value of the coefficients and constants in the standard form of the quadratic function, y = ax2 + bx + c. This investigation allowed you to determine the characteristics of a quadratic function written in standard form.
- The value of a in the function influences the steepness of the curve of the parabola or how wide the opening of the parabola is.
- If a is positive, the graph opens upwards. As the value of a increases above zero, the curve goes from very wide to more and more narrow.
- If the value of a is negative, the curve will open downward. As the value of a decreases below zero, the downward-opening curve becomes more and more narrow.
- If the value of a is zero, the graph forms a straight line and the relationship is a linear function, not a quadratic function.
- If a is positive, the graph opens upwards. As the value of a increases above zero, the curve goes from very wide to more and more narrow.
- The highest or lowest point on the graph of the quadratic function lies on its vertical line of symmetry.
- The location of the parabola’s line of symmetry can be changed by changing the value of b.
- The value of the parabola’s y-intercept is the constant term, c.1
In the next lesson you will investigate how to identify other characteristics of graphs of quadratic functions.
1 Adapted from: CANAVAN-MCGRATH ET AL. Principles of Mathematics 11, © 2012 Nelson Education Limited. p. 323. Reproduced by permission.