Lesson 2
1. Lesson 2
1.4. Discover
Module 3: Quadratics
Discover
Objects thrown or projected through the air tend to follow a parabolic path that can be described using a quadratic function. The path is called a trajectory. In your Module 3 Project, you will analyze the trajectory of projectiles based on data about the paths of the projectile.

The game Angry Birds, which held the spot as the number one paid app on the iPhone in many countries, requires users to use physics, mathematics, and logic to save stolen eggs.
In the game, being able to determine the trajectory of a bird is one strategy that can be used to destroy the enemy and capture stolen eggs. Each type of bird has unique characteristics. These characteristics affect the flight patterns of each bird. Contestants can change the angle at which the birds take-off in order to change its path and, hopefully, hit the intended target.
How is an understanding of the characteristics of quadratic functions a useful strategy for determining where birds that have a parabolic shaped trajectory will end up?
The shape and other characteristics of a parabola depend on the situation the quadratic function is modelling. For instance, some situations may have a parabola that opens upwards while other situations may have a parabola that opens downwards.
In Lesson 1 you identified certain characteristics of a quadratic function written in standard form y = ax2 + bx + c. You noticed that changing the value of a changes the shape of the graph while changing only b and c translates the parabola horizontally or vertically. From the graph of quadratic functions, you were able to see that the
- highest or lowest point on the graph of the quadratic function lies on the parabola’s vertical line of symmetry
- value of the parabola’s y-intercept is the same as the constant term, c, in the standard form of the quadratic
maximum value: the greatest value within the range (y-values) of a relation
minimum value: the least value within the range (y-values) of a relation
There are other characteristics of quadratic functions that can be used to help solve problems. For example, it is useful to know where the graph crosses the x-axis or what the maximum value or minimum value is for the graph.
Try This 1
Use the interactive applet Quadratic Graph Properties to determine additional characteristics of graphs of quadratic functions.
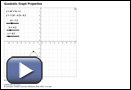
Use the a, b, and c sliders to create the following graphs. In your solutions, include a sketch or screenshot of the graph; the function that determines the graph; and the values of a, b, and c.
- Create a graph that opens up and crosses the x-axis two times.
- Create a graph that opens up and touches the x-axis once.
- Create a graph that opens up and does not touch the x-axis.
- Create a graph that opens down and crosses the x-axis two times.
- Create a graph that opens down and touches the x-axis once.
- Create a graph that opens down and does not touch the x-axis.
![]() Place a copy of your graphs in your course folder.
Place a copy of your graphs in your course folder.
Share 1
With a partner, compare the graphs that you created for Try This 1. Discuss how the shape of the graph is affected by the positive or negative value of a.
![]() Place a copy of your Share 1 answer in your course folder for reference.
Place a copy of your Share 1 answer in your course folder for reference.