Lesson 2
1. Lesson 2
1.7. Explore 3
Module 3: Quadratics
As you have seen, quadratic functions can be used to model different situations. The characteristics of graphs of quadratic functions can be used to gather information about a situation. This information can be helpful in solving problems.

Hemera/Thinkstock
Read “Learn About the Math” on pages 325 and 326 of the textbook. Note that the information Marko collected with his camera is the height of the volleyball at given times. This is not the same as the path of the volleyball, which would be height and horizontal distance. As you read through the example, consider how Marko used symmetry to estimate when the volleyball reached its maximum height.
Self-Check 2
Complete “Reflecting” questions A, B, and C on page 326 of the textbook. Answer
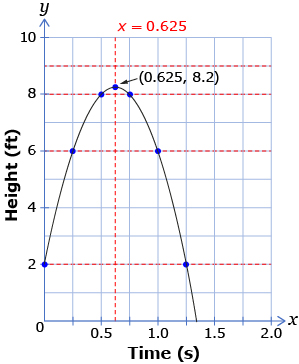
Marko used the data he collected to sketch a graph of the height of the volleyball against time. The graph was shaped like a parabola. From this graph, Marko was able to determine when the volleyball reached its greatest height. Marko noticed that the maximum height of the graph corresponds with the maximum value, or vertex, of the graph. He used points that have the same y-value to determine the equation of the axis of symmetry. The axis of symmetry is halfway between the two points with the same y-values.
axis of symmetry: a line that splits a figure such that both parts are mirror images of each other
Adapted from: CANAVAN-MCGRATH ET AL. Principles of Mathematics 11, © 2012 Nelson Education Limited. p. 326. Reproduced by permission.
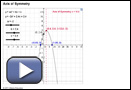
Use the applet Axis of Symmetry to explore the axis of symmetry in connection with the vertex and x-intercepts for different quadratic functions. Use the sliders for a, b, and c to create different parabolas.