Lesson 3
1. Lesson 3
1.4. Explore
Module 3: Quadratics
Explore
In Lesson 2 you used graphs to help solve problems that could be modelled by a quadratic function. Your graphing calculator is another tool you can use to solve problems involving quadratic functions. Your graphing calculator can be used to identify the coordinates of the vertex, help determine the domain and range, find maximum and minimum values, locate x- and y-intercepts, and determine the equation for the axis of symmetry of quadratic functions.

© Douglas J Glass/8207240/Fotolia
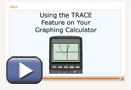
Watch the animation Using the TRACE Feature on Your Calculator to see how to enter a function into your calculator and use the TRACE features to find values on the graph.
You may have noticed that when using the ZOOM feature to find the x-intercepts, it is sometimes difficult to get your calculator to stop exactly at y = 0 to find the exact value of the x-intercept. You may have also found it difficult to be sure you had the exact minimum or maximum point as well. The calculator offers you help! There is a CALCULATE feature that you can access that will help find the exact coordinates for these points.
Watch the applet Using the CALCULATE Feature on Your Graphing Calculator to see how you can use your calculator to find exact coordinates.