Lesson 3
1. Lesson 3
1.6. Explore 3
Module 3: Quadratics
Sometimes it is helpful to specify the exact zoom you want on the screen.
Try This 1
Change the function in your calculator to Y1 = −0.4x2 + 7.2x − 14. Note that you must use the negative key, not the subtract key, in front of the 0.4.
Using the default window settings gives a graph that is too big for the screen. If you zoom out, the scale is too large and the grid scale is unreadable. You can set the scale of your graph using the WINDOW key. Change the WINDOW settings so the screen looks like the following:
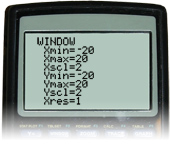
The “Xmax=20” tells you the scale on the x-axis will have a maximum value of 20. The “Xscl=2” tells you the scale on the x-axis will go up by 2. Now press the GRAPH key and see the graph clearly. Use the TRACE or CALCULATE feature to answer the following questions.
For the graph of the quadratic function Y1 = −0.4x2 + 7.2x − 14, use a graphing calculator to find the following to one decimal place when necessary:
- y-intercept
- first x-intercept
- coordinates of the vertex
- axis of symmetry
- maximum value
- second x-intercept
![]()
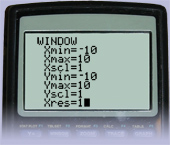
To reset the window settings back to the original default settings, you can access the WINDOW settings and enter in the values. Sample default window settings are shown.
Another approach is to reset the calculator to the default values.
- Press the 2nd key, which is below the Y= key.
- Press the + key. You have used the 2nd key; therefore, the second function of the + key, MEMORY, will be used.
- Select the Reset option (5 or 7, depending on your calculator).
- Select 2:Defaults....
- Select 2:Reset.
This will reset your entire calculator to the factory settings. You will need to put your calculator back in Degree mode.
Sometimes it is helpful to use this reset sequence if you have a screen that won’t display what you need it to because of previous inputs.
Directions to do this are also available in Reset the Graphing Calculator.
A table of values can also be used to help you determine an appropriate viewing window for the graph on your graphing calculator.
Read “Example 4: Locating a vertex using technology” on pages 330 and 331 of the textbook. As you read, consider how Isidro uses a table of values on a graphing calculator to make sure the graph models the situation.