Lesson 3
1. Lesson 3
1.5. Explore 5
Module 6: Proportional Reasoning
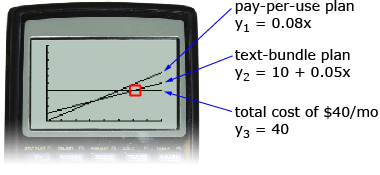
Akuti could also have used a graph to determine which plan was the better deal. Recall that linear functions can be entered into your graphing calculator or into a spreadsheet program. Begin by entering the two equations that Akuti developed to represent the two plans.
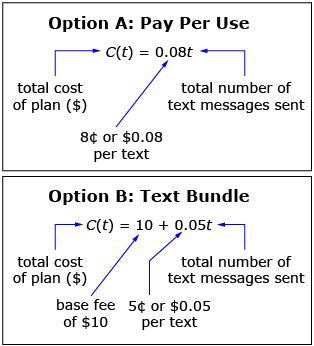
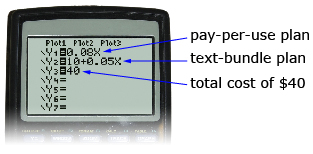
Since Akuti has a limit on what she can spend on the texting plan, you will also enter a third equation to represent that limit: Y3 = 40.
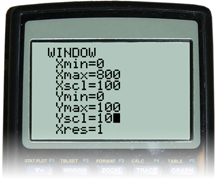
Before pressing the “Graph” button, you need to ensure that your window settings are set up correctly. This ensures that all three lines will show up on the screen.
- The domain of the graphs—represented by t in your equation—has to be greater than zero. (You can’t send a negative number of text messages.)
- The range of the graphs, which represents the total cost of the plan, has to be greater than zero.
A potential window setting is shown for a maximum of 800 text messages sent and a maximum cost of $100.
Now you can press the “Graph” button to show the graphs of the three lines.
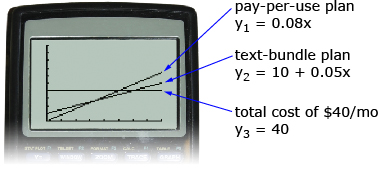
From the previous graph you can determine which plan allows the most text messages to be sent for $40. The values on the x-axis (the horizontal axis) represent the number of text messages sent. The graph that intersects the horizontal line, Y3 (total cost of $40) at a higher value on the x-axis (further to the right), shows the plan that is the better buy. This plan allows the most text messages for $40.
You can see from the calculations Akuti made, and from the graph, that the text-bundle plan is the better deal for Akuti. To determine how many more text messages can be sent, you can use the intersect feature on your graphing calculator.

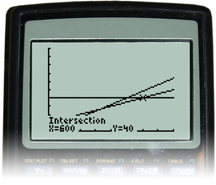
The text-bundle plan allows for 100 more text messages to be sent for $40 than the pay-per-use plan.
Try This 1
Using your graphing calculator, determine the maximum number of texts that Akuti could send in order for the pay-per-use plan to be the less expensive option. Note that, in this case, Akuti doesn’t have a $40-a-month budget.
You will begin with the same two equations since the cellphone plans are the same, but there is not a limit on what she will spend. The key to this question is to use your graph to find the point at which the pay-per-use plan costs less. Answer
Share 1
Working with a partner, discuss what other factors Akuti would need to consider before deciding on a texting plan.