Lesson 1
1. Lesson 1
1.10. Explore 6
Module 6: Exponents and Logarithms
Read “Example 1” on page 349 of the textbook. Notice how, in the example, each point is transformed first by the vertical stretch and then by the horizontal translation using a table.
Self-Check 3
- Complete “Your Turn” at the end of “Example 1” on page 351 of the textbook. Answer
- Complete question 8 on page 367 of the textbook. Answer
- Complete questions 1 to 5 in “Exponential Functions – Activity B.”
Screenshot reprinted with permission of ExploreLearning
You have graphed a given function using transformations. Can you write a function if given a graph? In Try This 5 you will look at an example of how bacteria growth can be modelled using an exponential function.
Try This 5

Wavebreak Media/Thinkstock
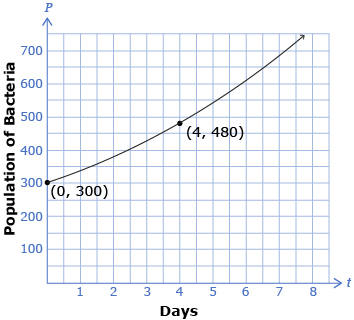
A scientist grew a type of bacteria in a Petri dish and started with 300 bacteria. The scientist found that the bacteria increased in population at an exponential rate of 60% every 4 d.
Answer the following questions to determine the exponential function for this situation in the form P = a(c)bt, where the population, P, is a function of the bacteria over time, t, in days. A graph of this situation is shown.
- Is the value of c > 1 or is 0 < c < 1?

- Determine the c-value. Explain your answer.
- Determine the b-value. Explain your answer.
- Determine the a-value. Explain your answer.
- Write the equation that models the growth of this bacteria in the form P = a(c)bt, where P is the population and t is the time in days.
![]() Save your responses in your course folder.
Save your responses in your course folder.