Lesson 1
Completion requirements
Created by IMSreader
1. Lesson 1
1.3. Refresher
Module 3: Quadratic Functions
Refresher
Use Graph to review how to complete a data table of values and draw a graph for a given function.
Review how to identify domain and range. Work through Concept Development Domain and Range, which offers information, practice questions, and feedback. You will need to click on Domain and Range on two different screens.
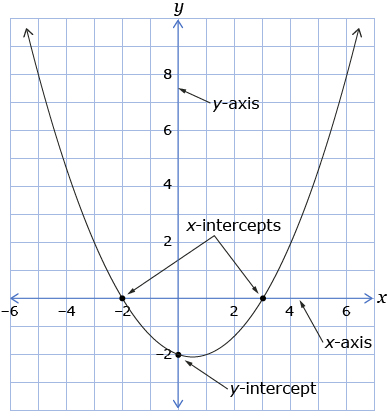
Practise identifying the x- and y-intercepts of a graph. An x-intercept of a graph is the x-coordinate of a point where the graph crosses the x-axis. A y-intercept of a graph is the y-coordinate of a point where the graph crosses the y-axis.
Go back to the Are You Ready? section, and try the questions again. If you are still having difficulty, contact your teacher.