Lesson 7
1. Lesson 7
1.6. Explore 2
Module 4: Quadratic Equations and Inequalities
Forms of Linear and Quadratic Inequalities
Linear and quadratic inequalities come in different forms. The following table summarizes the four different forms of each kind of inequality.
Linear Inequalities in Two Variables (a, b, and c are real numbers) |
Quadratic Inequalities in Two Variables (a, b, and c are real numbers and a ≠ 0 ) |
| ax + by < c | y < ax2 + bx + c |
| ax + by ≤ c | y ≤ ax2 + bx + c |
| ax + by > c | y > ax2 + bx + c |
| ax + by ≥ c | y ≥ ax2 + bx + c |
An ordered pair (x, y) is considered a solution of an inequality if, when the values of x and y are substituted into the inequality, the inequality is true.
Try This 2
It is time to confirm the observations you made in Try This 1. You will focus on how the properties of linear and quadratic inequalities relate to their graphs.
Open Linear Inequalities in Two Variables - Activity A and Quadratic Inequalities in Two Variables - Activity A.
Screenshot reprinted with permission of ExploreLearning

Screenshot reprinted with permission of ExploreLearning
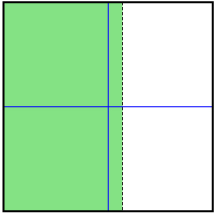
Consider the graphs shown.
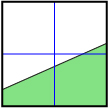
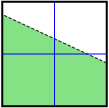
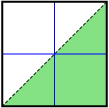
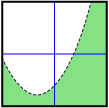
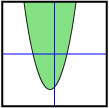
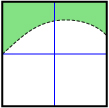
- For each graph, indicate whether the shaded region (in green) is above the boundary line or below the boundary line.
- For each graph, use either Linear Inequalities in Two Variables or Quadratic Inequalities in Two Variables to reconstruct the graph. Record the inequality you used to represent each graph.
![]() Save your response in your course folder.
Save your response in your course folder.
Share 1
Compare your results from Try This 2 with a partner. Note that you may not have the same inequalities for all, or any, of the graphs. However, you should have identical inequality symbols.
- Discuss or share any patterns you observed in both Try This 1 and Try This 2. These patterns may relate the inequality sign to
- the properties of the boundary lines
- the location of the shaded region
- the properties of the boundary lines
- Select a point on the boundary line of one of the inequalities. Then select a second point in the shaded region with the same x-coordinate as the point you previously selected. How do the y-coordinates of these two points compare to the inequality symbol used in the inequality?
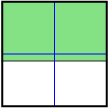
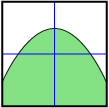
- Study the graph shown.
- Is the shaded region above or below the boundary line?
- How does this change the pattern for describing the shaded region?
- Is the shaded region above or below the boundary line?
![]() Save your response in your course folder.
Save your response in your course folder.