Lesson 7
1. Lesson 7
1.7. Explore 3
Module 4: Quadratic Equations and Inequalities
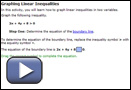
Graphing Inequalities in Two Variables

iStockphoto/Thinkstock
The graph of a linear inequality begins with the graph of a boundary line. The boundary line divides the coordinate plane into two separate regions, known as (open) half-planes. The boundary line is either dashed or solid, depending on whether the inequality permits points on the line to be included.
The half-plane that contains the points that satisfy the inequality is shaded. This set of points is known as the solution region.
Consider this strategy for graphing an inequality in two variables:
Step 1: Decide whether your boundary should be dashed or solid. If the inequality symbol is < or >, the boundary should be dashed. If the inequality symbol is ≤ or ≥, the boundary should be solid.
Step 2: Graph the boundary or the function corresponding to the inequality.
Step 3: Choose a point not on the boundary line. This is the test point.
Step 4: Check whether the test-point coordinates satisfy the inequality. If they do, shade the half-plane containing the point. If they don’t, shade the half-plane that does not contain the point.
Try This 3
Part A
- Graph the linear inequality 2x + 3y ≤ 6 using the steps in the strategy you just learned for graphing inequalities in two variables.
- Read part a. of “Example 1” and its solution on pages 466 and 467 of the textbook. This example is the same as question 1 above. Review both methods.
- Did you see the method you used in question 1 in the textbook solution?
- Which method do you prefer and why?
- Does your graph look the same as the one shown in the textbook?
- Did you see the method you used in question 1 in the textbook solution?
- Study part b. of “Example 1” on page 466. A possible method is presented for determining if a point is in the solution. Describe another method that can be used based on having a graph of the inequality.
Part B
- Graph the quadratic inequality y ≥ x2 − 4x − 5 using the same steps as in Part A, question 1.
- Turn to “Example 2” on page 492 of the textbook. Compare the method presented in the textbook to the method you used.
- Answer the following questions based on your reading.
- Why would (−1, 0) be a poor choice for a test point?
- Besides the test-point method, what other method could you use to determine the proper half-plane to shade?
- Why would (−1, 0) be a poor choice for a test point?
![]() Save your responses in your course folder.
Save your responses in your course folder.
Self-Check 1
Launch Graphing Linear Inequalities. Work through pages 1 to 8 only. Read each section carefully before responding to the prompt.