Lesson 7
1. Lesson 7
1.9. Explore 5
Module 4: Quadratic Equations and Inequalities
Using a Test Point to Determine the Graph of an Inequality

Watch Using a Test Point to see one way to approach Try This 4, question 2 using a test point. In the video, a misconception is introduced. Pay attention to what the misconception is and how to avoid it.
Self-Check 2

Test your skills by completing Understanding Inequalities.
Working with Constraints
Linear and quadratic inequalities can be used to model situations with constraints. For example, an architect may be constrained by such factors as the available space, the cost of the project, and environmental considerations.

Launch Graphing Linear Inequalities. In the lower right corner of the window, click on the green bar showing the page number. Select page 9, and then complete the exercises on pages 9 to 12. What constraints are imposed in this example situation?
Work through “Example 4” on page 495 in the textbook to see how a situation can be modelled with a quadratic inequality. As you read ask yourself what the significance of the solution region is?
Did You Know?

Khan Academy (CC BY-NC-SA 3.0)
You may have noticed in the textbook reading on page 495 that one of the graphs is created with technology. In Try This 1 you used an applet to graph inequalities in two variables. Did you know that you can also use your graphing calculator? Take a look at Graphing Inequalities with a Graphing Calculator.
Try This 5
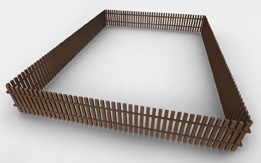
© GP/19600060/Fotolia
A designer is considering different ways to enclose a rectangular area. One of the constraints of the design is that a maximum of only 20 m of fencing is available.
- Write an inequality in terms of length,
 , and width, w, that represents the constraint.
- Graph the inequality from question 1. You can choose to represent either
 or w on the horizontal axis.
- Assume that another constraint on the length of the enclosed area is modelled by the inequality
 , where
  is the length of the rectangular enclosure and w is the width of the enclosure. Graph the inequality representing the second constraint on the same set of axes you used for the first constraint (question 2).
- Assume that the designer is only interested in whole-number dimensions. List all possible solutions.
![]() Save your answers in your course folder.
Save your answers in your course folder.