Lesson 7
1. Lesson 7
1.10. Connect
Module 4: Quadratic Equations and Inequalities
Connect
Lesson 7 Assignment
Open the Lesson 7 Assignment you saved in your course folder at the start of this lesson. Complete the assignment.
![]() Save your work in your course folder.
Save your work in your course folder.

Photos.com/Thinkstock
Project Connection

© wong yu liang/29976438/Fotolia
Go to Module 4 Project: Imagineering. Complete Step 5: Operations/Management.
![]() Save your work in your course folder.
Save your work in your course folder.
Going Beyond
Previously in this module you studied systems of linear-quadratic and quadratic-quadratic equations. The solution to such systems can be determined graphically by identifying the point(s) of intersection between the graphs of the equations in the system.
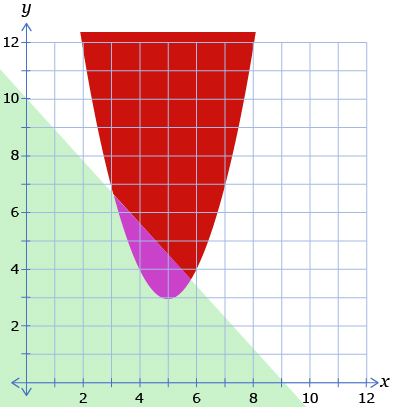
How would you determine the solution to a system of inequalities graphically? In other words, if you graphed two linear or quadratic inequalities on the same coordinate plane, where would your solution points be?
Try This 5 is an example of a system of inequalities. In that exercise you considered multiple constraints of a problem, and you determined possible solutions that satisfied both constraints.
Linear programming is the use of linear inequalities to model the constraints of a problem. The model can then be used to determine possible solutions by analyzing the overlapping shaded areas, known as feasible regions.

Screenshot reprinted with permission of ExploreLearning
Launch Linear Programming - Activity A to graph up to five linear inequalities at once. The program also introduces the concept of an objective function. The objective function is an equation whose value mathematicians try to maximize or minimize by substituting values of the feasible region into it. In a real-world application, this objective function might be profit, cost, area, and so on.