Lesson 8
1. Lesson 8
1.6. Explore 2
Module 4: Quadratic Equations and Inequalities
Solving Quadratic Inequalities in One Variable
A quadratic inequality in one variable can be written in any one of the following forms where a, b, and c are real numbers and a ≠ 0:
- ax2 + bx + c < 0
- ax2 + bx + c ≤ 0
- ax2 + bx + c > 0
- ax2 + bx + c ≥ 0
In Lesson 7, you explored inequalities in two variables. Quadratic inequalities in one variable may be solved by referring to the graphs of corresponding quadratic inequalities in two variables. The following inequalities in two variables correspond to the preceding inequalities in one variable:
- ax2 + bx + c < y
- ax2 + bx + c ≤ y
- ax2 + bx + c > y
- ax2 + bx + c ≥ y
In Discover you may have noticed something about the solution set of an inequality in one variable. The solution set corresponds to certain x-values of the graph of the corresponding inequality in two variables. Depending on the inequality, the chosen x-values will lie above, on, or below the x-axis. Quadratic inequalities in one variable can be solved by both graphical and algebraic methods.
The following example shows how you can solve quadratic inequalities in one variable by analyzing the graphs of corresponding functions in two variables. This example is based on the same question posed in Try This 1 question 4. Retrieve your work from Try This 1 so that you can compare your solution to the solution in the example.
Example
Solve x2 − 2x − 8 ≥ 0.
Solution
Graph the corresponding function y = x2 − 2x − 8.

The problem asks for the solutions to x2 − 2x − 8 ≥ 0. Since the function that the graph represents is y = x2 − 2x − 8, you need to determine where y ≥ 0. You can do this by identifying the points on the graph where the y-coordinate is greater than or equal to 0. These points are on and above the x-axis, shown in red on the following graph.
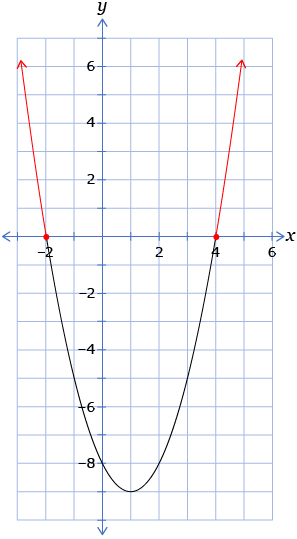
You can report the solution as the domain of the parts of the graph highlighted in red. The domain is all real values less than or equal to –2 or greater than or equal to 4.
The solution set is {x | x ≤ − 2 or x ≥ 4, x ∈ R}.
Compare your solution from Try This 1 to the solution in the example. Make any necessary revisions to your work.
Turn to “Example 1” on pages 478 to 479 of the textbook. You are asked to solve a different quadratic inequality. Work your way through Method 1 only. Ask yourself the following questions as you work through the method:
- What other ways could you report the solution?

- How can you sketch the graph of a quadratic function when the function is written in standard form?
Self-Check 1
Use the following information to answer the next two questions.
- What is the solution to the quadratic inequality −5x2 + 20x − 15 < 0?
- x < 1
- x > 3
- 1 < x < 3
- x < 1 or x > 3
- What is the solution to the quadratic inequality −5x2 + 20x − 15 ≥ 0?
- 1 < x < 3
- 1 ≤ x ≤ 3
- x < 1 or x > 3
- x ≤ 1 or x ≥ 3
- Select the choice or choices for which the stated value of x is a solution to the given inequality.
- x = 0 for −x2 − 5x + 1 < 0
- x = −3 for x2 + x − 6 > 0
- x = 12 for −0.5x2 + 4x + 17 ≥ 0
- x = 1 for 2x2 − 7x + 3 ≤ 0
- The solution to the inequality 2x2 − 7x ≤ 3 is found in the interval a ≤ x ≤ b. What is the sum of a and b to the nearest tenth? Answer