Section 1
1. Section 1
1.23. Lesson 3
Section 1: Personal Budgets
Lesson 3: Displaying a Budget
Focus
The budgeting process is a necessary part of planning for individuals, businesses, and governments. To clarify budget estimates, businesses and governments both use graphs. One of the principal graphs used is the circle graph or pie graph. This form of graph is used to show how the money is divided. The following illustration is a pie graph used by the Northwest Territories government to outline its spending estimates for the fiscal year 2011–2012.
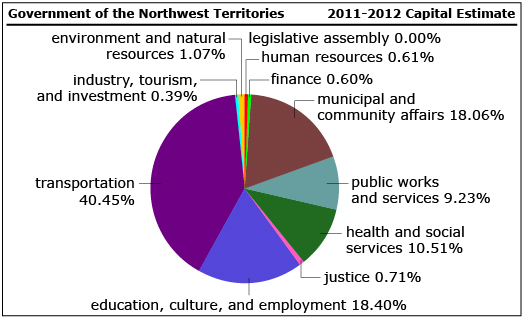
Department of Finance, Capital Estimates 2011-2012 (Yellowknife: Government of the Northwest Territories, 2010), iii. Adapted and reproduced with permission.
A circle graph or pie graph represents the entire circle or pie. The sectors or wedges of the pie indicate the graph divisions. In what sector does the government of the Northwest Territories estimate it will spend the largest portion of money?
Lesson Question
In this lesson you will investigate the following question:
How can you represent a personal budget using a circle or pie graph?
Assessment
Your assessment for this lesson may include a combination of the following:
- course folder submissions from Try This and Share
- your contribution to the Mathematics 20-3: Glossary Terms
- Lesson 3 Assignment (Save a copy of your lesson assignment to your course folder now.)
- the Project Connection
Materials and Equipment
- calculator
- protractor
- ruler
- compass