Section 1
1. Section 1
1.38. Explore 2
Section 1: Simple and Compound Interest
The graph of a compound interest investment shows growth described by a curved increasing line—this type of growth is called exponential growth. The graph of a simple interest investment shows growth described by a straight line: this type of growth is called linear growth.
In Try This 2 you investigated the spreadsheet graphs for investments earning simple and compound interest over short periods of time. Here is another example of graphs showing the power of compound interest over a much longer period of time.
Notice again that the simple interest graph forms a straight line, while the compound interest graph sweeps upward to the right.
In this example, $1000 is invested at 6% for 50 years. What is the difference in the final amounts?
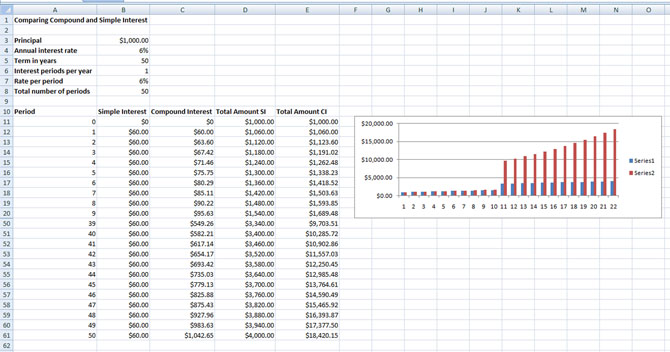
© Microsoft Corporation. All Rights Reserved. Used with permission from Microsoft Corporation.
The difference in earnings between simple interest and compound interest is $14 420.15, which is a huge difference over 50 years. This example really shows the power of compound interest.