Lesson 1
1. Lesson 1
1.8. Explore 4
Module 1: Probability
Self-Check 2
An experiment is performed that consists of spinning a spinner and recording the results.
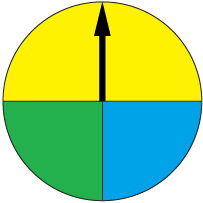
The results from 40 spins are recorded in the following table.
Outcome |
Frequency |
yellow |
23 |
green |
6 |
blue |
11 |
Total |
40 |
- Express each question outcome in a different way, such as a fraction, decimal, or percent.
- If the spinner was spun 120 times, how many times would you expect it to land on yellow? Answer
![]()
- Answer “Build Your Skills” questions 2 and 3 from page 154. Answer
random sample: a sample randomly selected from a larger population
In business and industry, smaller random samples are often taken from a larger group to help make informed decisions. The information gained from the random sample can be used to make predictions and estimates about the larger group. The larger group is often called a population. In the next activity, you will explore the idea of random sampling.
Try This 3

iStockphoto/Thinkstock
As media players come off the assembly line, they are tested to see if they are defective in any way. It is not practical, due to time and money constraints, to test each media player. The supervisor decides to assign an employee to test a random sample of the media players.
Out of the 386 media players in the random sample, it was found that 4 were defective in some way.
- Express the probability of a media player being defective as a fraction, a decimal, a percentage, and in a statement.
- If 12 000 media players were produced in a production run, how many would you expect, based on the results of the random sample, to be defective?
![]() Save your responses in your course folder.
Save your responses in your course folder.