Lesson 2
1. Lesson 2
1.1. Discover
Module 1: Probability
Discover
Creatas/Thinkstock
In Lesson 1 of this module you experimented with experimental probability by rolling a six-sided standard die multiple times and recording the results. The experimental probability was determined based on the results of the experiment.
For example, if you rolled a four 10 times in 36 rolls of the die, then your experimental probability would have been ![]() Expressed as a percent, the probability of rolling a four in your experiment was approximately 27.8%. Does this sound reasonable? Would you use your experimental results to help you make a good decision? That is, if you were asked to predict the outcome of the next roll of the die, could you confidently say that it would be a four?
Expressed as a percent, the probability of rolling a four in your experiment was approximately 27.8%. Does this sound reasonable? Would you use your experimental results to help you make a good decision? That is, if you were asked to predict the outcome of the next roll of the die, could you confidently say that it would be a four?
Now dive deeper and continue to explore your predicting abilities. This time it will involve calculating the absolute difference when you roll two dice!
Try This 1

Open Dice Roller and use it to complete the experiment and answer the following questions.
In this experiment you will be rolling two dice and recording the difference in their outcomes (you will always subtract the smaller value from the larger value).
- Prior to rolling the dice, list the set of possible outcomes for the experiment. Keep in mind that your possible outcomes are based on the difference between the values on the two dice.
- Next, make predictions to the following questions.
- Will some of the outcomes occur more frequently than others?
- Which outcome(s) do you expect will occur most often?
- Which outcome(s) do you expect will occur least often?
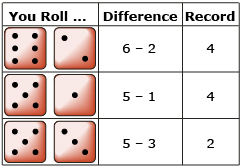
- Roll the dice a total of 36 times. Using the difference between the value on the two dice as the outcome, record the tally and frequency in a table similar to the one shown.
Outcome
Tally
Frequency
Experimental
Probability0
1
2
3
4
5
Total
36
36
- Next, determine the experimental probability for each outcome. Record the results in the last column of your table.

-
Based on the results of your experiment, answer the following questions.
- Were your predictions of the least and the most expected outcomes correct?
- How confident are you that your experimental probability results are very close to those of other students or groups performing the same experiment?
- If you were to perform this experiment with 10 times the number of dice rolls, how might this change the experimental probability? If you had 100 times the number of dice rolls, would the experimental probability change? Explain.
Share 1
With a partner or in a group, discuss the results of your experiment and your responses to the questions in Try This 1. Compare your findings. Explain why there may be similarities and differences.
![]() Save a summary of your discussion in your course folder.
Save a summary of your discussion in your course folder.