Lesson 3
Completion requirements
Created by IMSreader
1. Lesson 3
1.1. Discover
Module 1: Probability
Discover
You have been calculating the experimental and theoretical probability of an event. You know that ![]() You will now examine the probability of event A not occurring.
You will now examine the probability of event A not occurring.
Try This 1
Consider the following set of shapes.
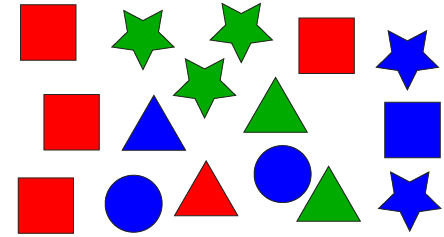
- Complete the following table to show the number of each type of shape. The first row has been completed for you.
Red
Green
Blue
Total
Triangle
1
2
1
4
Square
Star
Circle
Total
-
- Suppose you were to choose a shape at random. Explain how you could compare the chance of getting a shape that is red to the chance of getting a shape that is not red.

- Use the strategy you described above to compare the chance of getting a square to getting a shape that is not a square.
- Suppose you were to choose a shape at random. Explain how you could compare the chance of getting a shape that is red to the chance of getting a shape that is not red.
-
- Calculate the probability of choosing a shape that is red, and the probability of choosing a shape that is not red.
- Calculate the probability of choosing a square and choosing a shape that is not a square.
- Calculate the probability of choosing each colour.
![]() Save your work in your course folder.
Save your work in your course folder.
Share 1
With a partner or in a group, share your responses from the Try This 1.
- How did your strategies for calculating the chance of getting a specific shape, and the chance of not getting a specific shape from question 2 compare?
- How are the probabilities you calculated in question 3 related to the comparisons you made in question 2?
![]() Save your work in your course folder.
Save your work in your course folder.
There are 6 red shapes out of 17 and 11 non-red shapes out of 17. You could say the ratio of red to non-red is 6:11.