Lesson 3
1. Lesson 3
1.4. Explore 3
Module 1: Probability
In Try This 3 you may have found that both odds and probability can be used to express the chance of something happening. However, consider the following table.
Odds |
Probability |
compares an event to its alternatives |
compares an event to all possible outcomes |
From previous lessons, you learned that the probability of an event is the number of favourable outcomes divided by the total possible outcomes. The odds in favour of an event occurring is the ratio of the number of ways the event may occur to the number of ways the event does not occur.

Sometimes it is useful to determine the odds when you know a probability. Complete the following Try This activity to explore this idea.
Try This 4
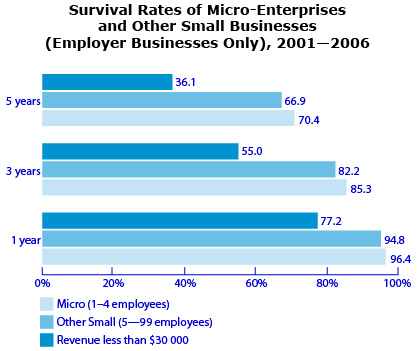
Source: �Figure 3: Survival Rates of Micro-Enterprises and Other Small Businesses (Employer Businesses Only), 2001�2006.� Key Small Business Statistics - January 2009: How long do small businesses survive? (Industry Canada, 2009), <http://www.ic.gc.ca/eic/site/sbrp-rppe.nsf/eng/rd02345.html>; (11 March 2012)
The survival of small businesses depends on a number of factors, which may include location, size, availability of capital, education of employees and management, age of business, innovation, and the business plan. These factors can be controlled and/or are predictable, but there are also factors that are unforeseen, such as the current economy, the market influences, and the number of competitors. Regardless of the factors, the goal of all business owners is to increase the odds of success, and thus survive.
The graph shows the survival rates for three different sized small businesses in Canada. These success rates are examples of experimental probabilities. Use these to answer the following questions.
-
- Which of the three types of small businesses has the greatest survival rate?
- Explain the relationship between the length of time in business and the survival rate for small businesses.
-
- What is the probability that a microbusiness will survive three years?
- What are the odds of a microbusiness surviving three years?
- What are the odds against a microbusiness surviving three years?
- Suppose you watched 450 new businesses with 5–99 employees for five years.
- How many businesses do you expect to survive?
- How many businesses do you expect to fail?
![]() Save your work in your course folder.
Save your work in your course folder.
Share 3
With a partner or in a group, share the results of your responses to Try This 4, and answer the following questions.
- Explain why the odds of a business surviving decreases as time increases.
- Explain the relationship between the number of successes, the number of failures, and the total number of businesses.
- List some reasons that could cause a new business to fail.
![]() Save your work in your course folder.
Save your work in your course folder.