Lesson 4
1. Lesson 4
1.1. Discover
Module 1: Probability
Discover
Disasters such as asteroids hitting the Earth are not likely. However, there are many other natural disasters that are much more likely to occur.
Try This 1
An earthquake can be a frightening event, and major ones have the potential to cause significant damage. Moderate and major earthquakes are more common off the coast of British Columbia than other areas of Canada. The following image shows how the Richter scale is used to measure the magnitude of an earthquake. Larger numbers on this scale indicate more violent shaking. Open “Earthquakes in or near Canada, 1627 – 2012” to see a larger version of the image.
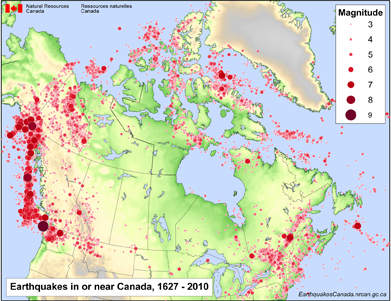
Source: Earthquakes in or near Canada, 1627 - 2010, (Natural Resources Canada, 2012),
< http://www.earthquakescanada.nrcan.gc.ca/historic-historique/images/caneqmap_e.pdf>; (11 March 2012).
| MMI | Description of Effects |
| V | Felt indoors by practically all, outdoors by many or most. Buildings tremble throughout. Broken dishes and glassware to some extent. Hanging objects and doors swing, generally. Pictures knocked against walls or swung out of place. |
| VI | Felt by all, indoors and outdoors. General excitement, some alarm. Damage slight in poorly built buildings. Fall of plaster, cracks in plaster, and fine cracks in chimneys in some instances. Broken dishes and glassware in considerable quantity, as well as some windows. Overturned furniture in many instances. |
| VII | General alarm, all run outdoors. Some or many find it difficult to stand. Damage negligible in buildings of good design, slight to moderate in ordinary buildings and considerable in poorly built or badly designed buildings. Cracked chimneys to considerable extent and walls to some extent. Fall of plaster in considerable to large amounts. Dislodged brick and stone. Overturned heavy furniture. |
Source: Probabilities Of Significant Earthquake Shaking In Communities Across British Columbia: Implications For Emergency Management, 1627 - 2010, (Natural Resources Canada, 2010) <ftp://seismo.nrcan.gc.ca/pub/hazardpubs/13WCEEp1065Onur_Seemann.pdf> (11 March 2012).
The following image shows the distribution of earthquake shaking probabilities in BC within a 100-year period (for firm ground). Open “Probabilities Of Significant Earthquake Shaking” to see a larger version of the image.
Modified Mercalli Intensity (MMI) is a descriptive scale based on how severely the shaking was felt and how much damage certain types of structures suffered at a certain location.
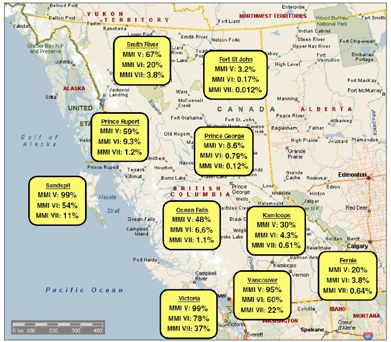
Distribution of earthquake shaking probabilities in
BC within a 100-year period (for firm ground)
Source: Probabilities Of Significant Earthquake Shaking In Communities Across British Columbia:
Implications For Emergency Management, 1627 - 2010, (Natural Resources Canada, 2010),
<ftp://seismo.nrcan.gc.ca/pub/hazardpubs/13WCEEp1065Onur_Seemann.pdf> (11 March 2012).
Probabilities of Exceeding MMI V, VI, and VII on Firm Ground in 10, 50, and 100 Years (Selected Communities)
| Community | P[MMl ≥ V] (%) in: | P[MMl ≥ Vl] (%) in: | P[MMl ≥ Vll] (%) in: | ||||||
| 10 years | 50 years | 100 years | 10 years | 50 years | 100 years | 10 years | 50 years | 100 years | |
| Vancouver | 26 | 77 | 95 | 8.6 | 36 | 60 | 2.5 | 12 | 22 |
| Victoria | 35 | 88 | 99 | 14 | 53 | 78 | 4.5 | 21 | 37 |
| Kamloops | 3.5 | 16 | 30 | 0.44 | 2.2 | 4.3 | 0.061 | 0.31 | 0.61 |
| Prince George | 0.89 | 4.4 | 8.6 | 0.079 | 0.40 | 0.79 | 0.012 | 0.058 | 0.12 |
| Fort St. John | 0.33 | 1.6 | 3.2 | 0.017 | 0.083 | 0.17 | 0.001 | 0.006 | 0.012 |
| Prince Rupert | 8.5 | 36 | 59 | 0.97 | 4.7 | 9.3 | 0.12 | 0.59 | 1.2 |
| Fernie | 2.2 | 11 | 20 | 0.39 | 1.9 | 3.8 | 0.064 | 0.32 | 0.64 |
| Sandspit | 35 | 88 | 99 | 7.4 | 32 | 54 | 1.2 | 5.7 | 11 |
| Smith River | 11 | 43 | 67 | 2.2 | 11 | 20 | 0.39 | 1.9 | 3.8 |
| Ocean Falls | 6.3 | 28 | 48 | 0.68 | 3.4 | 6.6 | 0.11 | 0.53 | 1.1 |
Source: Probabilities Of Significant Earthquake Shaking In Communities Across British Columbia: Implications For Emergency Management, 1627 - 2010, (Natural Resources Canada, 2010), <ftp://seismo.nrcan.gc.ca/pub/hazardpubs/13WCEEp1065Onur_Seemann.pdf> (11 March 2012).
Use the information from the map and table to answer the following questions.
-
- Which type of Modified Mercalli Intensity (MMI) scale effect level is the most common? Explain.
- Explain the relationship between the earthquake occurrences map and the earthquake probability map.
-
- Which location is the most prone to earthquakes? Explain.
- Which location is the least prone to earthquakes? Explain.
- What happens to the probability of an earthquake being felt as the number of years increase between earthquakes? Explain why this happens.
-
- How many earthquake effects of MMI VII or greater do you predict will be felt in Vancouver in the next 1000 years? Explain your thinking.
- How many earthquakes of MMI VII or greater will be felt in Fort St. John in the next 1 000 000 years? Explain your thinking.
- Suppose two earthquakes of MMI V had been felt in Quebec City in the last decade. Explain whether or not it is reasonable to assume the next decade will include two earthquakes of similar size.
- Suppose an insurance company is planning to sell earthquake insurance in British Columbia. The rate the company will charge is to be based on the risk of the client. That is, if the company expects to pay the client more over a long period, the client will be charged more.
- Which area do you expect to have the least expensive earthquake insurance? Explain.
- Which area do you expect to have the most expensive earthquake insurance? Explain.
![]() Save your responses in your course folder.
Save your responses in your course folder.
Share 1
With a partner or in a group, share your responses to the Try This questions. Then answer the following questions with your partner or group.
-
- The British Columbia earthquake probability table shows the probability that one or more earthquakes of a given size will occur. This means more than one earthquake of a given size can occur in the time period. Does this information change your estimate from question 4.a.? If so, explain how.
- Question 4.b. asked you to predict the number of earthquakes in Fort St. John for 1 000 000 years. Explain why this may not be a sound prediction.
-
- How do you expect an emergency management organization would use the earthquake data to help make decisions?
- What other organizations would find this information useful? How might they use it?
- Earthquake probabilities are one factor an insurance company may consider when determining rates. Describe some other factors.