Lesson 4
1. Lesson 4
1.3. Explore 2
Module 1: Probability
Try This 2

Photos.com/Thinkstock
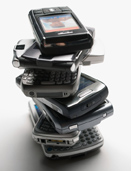
You want to buy a new smartphone, but you’re not sure what brand to buy. You are interested in specific features, but you are also interested in reliability. Some of your friends say that the iPhone is the best product, but others insist the Blackberry is the way to go.
How can you find out about the reliability of a variety of phones? There are many consumer organizations that test consumer products. Their websites would be a good place to start.
In November 2011, failure rates of over 50 000 smartphones were analyzed by a warranty company. The reported 12-month malfunction rates for a variety of phones are shown in the following table.
| Brand of Smartphone |
12-Month Malfunction Rate |
| iPhone 4 | 2.1% |
| iPhone 3GS | 2.3% |
| Motorola | 2.3% |
| HTC | 3.7% |
| Blackberry | 6.3% |
| Other Smartphones | 6.7% |
Source: Smart Phone reliability: Apple iPhones with fewest failures, and major Android manufacturers not far behind.
<http://www.squaretrade.com/pages/cell-phone-comparisonstudy-nov-10>; (11 March 2012).
From the table, you can say the probability that an iPhone 4 will malfunction in the first year is 2.1%. You could also say that the odds of it malfunctioning in the first year are 2.1%:97.9%.
- Add a column to the previous table to show the odds of each phone malfunctioning in the first year.
Brand of
Smartphone12-Month
Malfunction RateOdds of
Phone Malfunctioning - Research another website that has analyzed the failure rate of smartphones. Prepare a table similar to question 1 for the information you find. If the failure rates differ from the previous ones, can you suggest a reason for this?
Another consideration in buying a new phone may be its ability to survive accidents such as falls. The following table gives the reported accident rate after 12 months for the same phones as in the previous table.
| Brand of Smartphone |
Reported Accident Rate after 12 Months |
| iPhone 4 | 13.8% |
| iPhone 3GS | 9.4% |
| Motorola | 12.2% |
| HTC | 12.2% |
| Blackberry | 6.7% |
| Other Smartphones | 10.2% |
Source: Smart Phone reliability: Apple iPhones with fewest failures, and major Android manufacturers not far behind. <http://www.squaretrade.com/pages/cell-phone-comparisonstudy-nov-10>; (11 March 2012).
- Create a new table with the accident rate for each phone expressed as a percent, decimal, and fraction. Add a column with the accident rate expressed as the odds of an accident in the first year.
-
For each phone, add the malfunction rate to the accident rate to determine the overall failure rates after 12 months. Next, give the odds of the phone failing in the first year.
- Given the information you have about a variety of smartphones, which one would you buy? Justify your selection.
![]() Save your responses in your course folder.
Save your responses in your course folder.
Share 2
With a partner or in a group, share your responses to the Try This 2 questions. Answer the following questions with your partner or group.
- Beyond failure rates, what other information would you consider before buying a smartphone?
- The malfunction and accident rates from Try This 2 were collected by a warranty company.
- How do you suppose the warranty company would use this information?
- The malfunction and accident rates were collected by counting only those reported to the warranty company. Do you expect the true rates to be higher or lower than these? Explain.