Lesson 1
Completion requirements
Created by IMSreader
1. Lesson 1
1.5. Explore
Module 3: Algebra
Explore
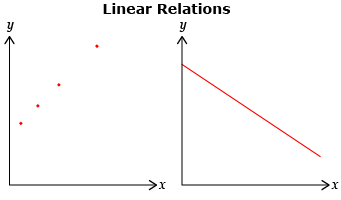
linear relation: a relationship between two variables that forms a straight line when you plot values of ordered pairs on a graph
Source: MathWorks 12 Student Book/Teacher Guide. (Vancouver: Pacific Educational Press, 2011.)
In Math Lab you probably found that some graphs produce points that lie along a straight line. This is called a linear relation.
Were all the relations that you graphed in the Math Lab linear relations? In Try This 1 you will explore how to graph a linear relation that involves wages.
Try This 1
Rashib has a job that pays him $18.00/h for 40 h/wk.
- Complete a table similar to the one shown.
Number of Hours Worked
Amount of Money Made ($)
0
0
8
144
16
24
32
576
40
- How much will Rashib earn by the end of the week?
- How much do you think he will earn if he only works 30 hours in the week? Explain.
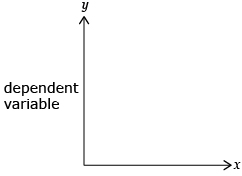
- Does one quantity in the table depend on the other?

This quantity is called the dependent variable and is placed along the vertical axis.
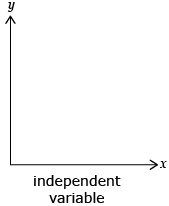
- Is one quantity independent of the other?
This quantity is called the independent variable and is placed along the horizontal axis.
- Graph the number of hours worked versus the amount of money made.
- Review your response to question 3. Does your graph support your estimate of earnings over a 30-h week? Explain.
![]() Save your responses in your course folder.
Save your responses in your course folder.
In other words, is one quantity freely chosen?
Does number of hours worked depend on the amount of money made or vice versa?