Lesson 1
1. Lesson 1
1.7. Explore 3
Module 3: Algebra
In Share 2 you should have noticed that each graph is a straight line, resulting in a linear relation.
The graph you constructed in Try This 1 should have resembled the following graph:
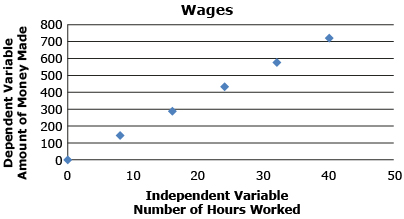
Notice that the graph is a straight line passing through the origin (0, 0), making it a direct linear relation.
The graph you constructed in Try This 2 should have resembled the following graph:
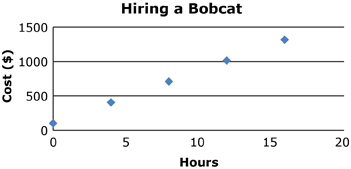
Notice that the graph results in a straight line that does not pass through the origin, or (0, 0). This is called a partial linear relation. The point where the graph touches or cuts the y-axis is called the y-intercept.
In each of the graphs, the rate of change remains constant. Recall from a previous math course that the rate of change for a straight line is also referred to as the slope of the line. The slope compares the variables x and y, meaning that the change in the dependent variable (y) is proportional to the change in the independent variable (x).
For example, the table shows that for every 8-h increase in the number of hours worked (independent variable, or x), the amount of money made (dependent variable, or y) increases by 144.
Number of Hours Worked |
Amount of Money Made |
0 |
0 |
8 |
144 |
16 |
288 |
24 |
432 |
32 |
576 |
40 |
720 |
Try This 3
Open Partial and Direct Relations and adjust the sliders to respond to the following questions.
- What characteristics of the graph can be changed for the direct linear relation?
- What characteristics of the graph can be changed for the partial linear relation?
- What effect on the line does changing the y-intercept have?
- What effect on the line does changing the slope have?
![]() Save your responses in your course folder.
Save your responses in your course folder.