1. Lesson 1

1.12. Lesson 1 Summary

Mathematics 30-3 Module 3

Module 3: Algebra


Lesson 1 Summary


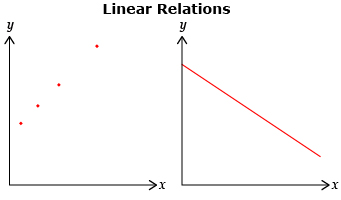
In this lesson you looked at examples of linear and nonlinear relations. Linear relations yield graphs that form a straight line.


The slope of a straight line can be found using any two points and the formula  .


Direct linear relations pass through the origin (0, 0); and partial linear relations do not.


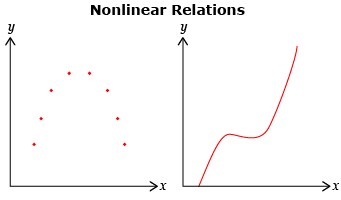
Nonlinear relations yield graphs that are not straight lines.


This is a diagram titled Linear Relations that shows two graphs. The first graph shows points that fall in a straight line that rises (increases) from left to right. The second graph shows a straight line that falls (decreases) from left to right. The diagram is titled Nonlinear Relations and shows two graphs. The first graph shows points that increase, and then decrease as you proceed to the right. The second graph is a curve that increases, decreases, and then increases again as you proceed to the right.