Lesson 1
1. Lesson 1
1.6. Explore 2
Module 4: Statistics
So far in this lesson, you have explored how the arithmetic mean can represent the average of a set of data. Now it's time to explore two other common measures of central tendency—the median and the mode. These measurements can also be used to describe a set of numbers using a single value.

Ingram Publishing/Thinkstock
Median is the middle or midpoint value of a set of numbers when arranged in order.
In the mountain range shown, which peak represents the median?
iStockphoto/Thinkstock/Coin image© 2012 Royal
Canadian Mint – All Rights Reserved
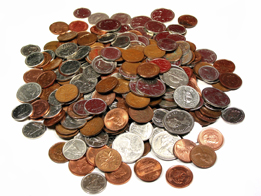
Mode is the value that occurs most often in the given set of data.
In the pile of coins shown, which type of coin represents the mode?
In Try This 2 you will use the ideas of mean, median, and mode on a set of numbers.
Try This 2
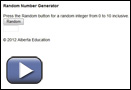
Use the Random Number Generator to generate 15 random numbers. Record the numbers and calculate the mean, median, and mode.
Then generate 20 random numbers and calculate the mean, median, and mode of those numbers.
In your course folder, record the process or steps you used to determine each measure of central tendency—mean, median, and mode. If you had any questions about the activity, write them down. Keep your work handy as you will be referring back to it shortly.