Lesson 2
1. Lesson 2
1.3. Explore 2
Module 4: Statistics
Hemera/Thinkstock
As you completed Self-Check 1, you may have noticed that Vancouver’s average housing price greatly influenced the mean, causing Canada’s average housing cost to be higher. However, it may have had little influence on the median.
Vancouver’s data is an example of an outlier. As you learned in Module 3, an outlier is a data point that is significantly different from the other data. If you were to graph the data, you would notice that an outlier would lie “outside” the other data.
outlier: a data point that lies significantly outside the general trend of the data
Source: MathWorks 12 Student Book/Teacher Guide.
(Vancouver: Pacific Educational Press, 2011.)
Self-Check 2
In each set of data, identify the outlier(s), if any, and justify why they are outliers.
- 7, 24, 24, 28, 31, 35 Answer
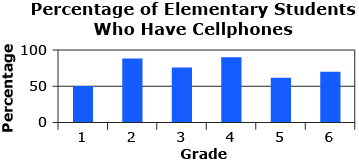
- Use the data from the bar graph.
Answer - Use the data from the graph.
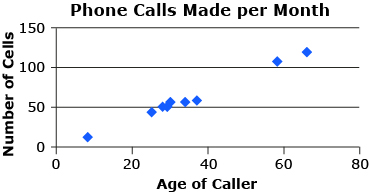
Answer
Try This 2
Use the Mean, Median, Mode activity to explore the effect of outliers on mean, median, and mode.
Use this table of data sets to answer the following questions.
Data Set 1 |
20, 22, 22, 25, 26 |
Data Set 2 |
20, 22, 22, 25, 26, 40 |
Data Set 3 |
20, 22, 22, 25, 26, 100 |
- Find the mean, median, and mode for each data set using the Mean, Median, Mode interactive. Record your solutions in a table similar to the following.
Central Tendency Measure
Mean
Median
Mode
Data Set 1
Data Set 2
Data Set 3
- Rank mean, median, and mode from the least to most affected by adding one outlier to Data Set 1.
![]() Save your responses in your course folder.
Save your responses in your course folder.
Share 1
With a partner or in a group, share your answers to Try This 2. If you have answers that differ, share strategies and try to make corrections. If you can’t agree on an answer, consult your teacher.
![]() If required, place a summary of your discussion in your course folder.
If required, place a summary of your discussion in your course folder.