Lesson 2
1. Lesson 2
1.4. Explore 3
Module 4: Statistics

Comstock/Thinkstock
In Try This 2 you saw that the mode did not change with the addition of outliers. This will be the case with most data you work with. The median, however, may change slightly when one outlier is added.
The mean is most affected by outliers. In Try This 2 you saw that the mean was above most of the data points. This is because the outlier is in a sense “pulling” the mean towards it, which causes the data to be skewed upward. That would be the same for the salaries of movie stars. The salaries of the most popular or famous movie stars would skew the average upward.
Leaving all data points in the calculation of mean may result in a value that is not representative of the data set. For example, suppose you were to measure the heights of all people in a kindergarten class, including the teacher. The mean calculated from this data set will likely be larger than all the students, yet smaller than the teacher. Therefore, the calculated mean would not accurately represent the average height of the kindergarten class.
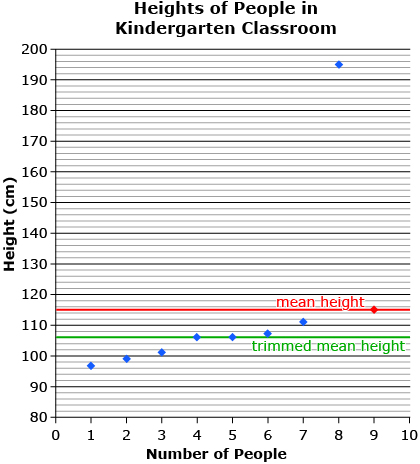
trimmed mean: the mean calculated by disregarding an equal number of data points from both ends of the range
Source: MathWorks 12 Student Book/Teacher Guide. (Vancouver:Pacific Educational Press, 2011.)
A trimmed mean is the mean calculated by ignoring an equal number of data points from either end of the range. For example, calculating the trimmed mean for the height of people in the kindergarten class would require removing the tallest and the smallest heights from the data. When calculating mean in any given circumstance, you must consider the context of the question and give reasons for why you decide to trim or not to trim your data.
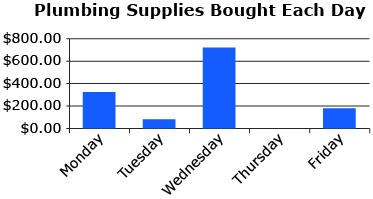
Here is an example that shows when outlying data may be included in your calculations.
Suppose Alberta, a plumber, wants to estimate her weekly cost for supplies. She records and graphs her purchase totals each day for a week. Notice that Alberta’s total purchases on Wednesdayresult in a distinct outlier. If Alberta excluded this data point from her estimate, the result would be an estimate that is not really reflective of the average weekly costs. In this example, it is important that all data points be used in calculating the mean, which results in a better estimate of weekly costs.
Try This 3
Find the mean and trimmed mean for each data set using the Mean, Median, Mode interactive.

Use this table of data sets to answer the following questions.
Data Set 1 |
20, 22, 22, 25, 26 |
Data Set 2 |
20, 22, 22, 25, 26, 40 |
Data Set 3 |
20, 22, 22, 25, 26, 100 |
Record your solutions in a table similar to the following.
Central Tendency Measure |
Mean |
Trimmed Mean with Two Omitted Points |
Data Set 1 |
|
|
Data Set 2 |
|
|
Data Set 3 |
|
|
- Which data set has the biggest difference between mean and trimmed mean?
- Does the mean or the trimmed mean best represent the data set?
Share 2
Consider your findings and share your answers with a partner.
![]() If required, place a summary of your discussion in your course folder.
If required, place a summary of your discussion in your course folder.