Lesson 1
1. Lesson 1
1.5. Explore
Module 7: Exponents and Logarithms
Explore

Hemera/Thinkstock
In Try This 1 you worked with an example of exponential growth. You may have determined that after folding a piece of paper in half eight times, 256 layers of paper were created. The relationship L = 2f describes the number of layers created, L, as a function of the number of folds, f. You will notice that the variable f is an exponent; therefore, L = 2f is considered an exponential function.
The formal mathematical notation of an exponential function is written as y = a(b)x, where a ≠ 0, b > 0, and b ≠ 1.
In Try This 2 you will explore the characteristics of the graphs of exponential functions.
Try This 2
Open the Exponential Functions activity.
- Complete a table like the following using the Exponential Functions activity.
Value of b
2 4
0.7 0.5 Function (y = bx) y = 2x Sketch 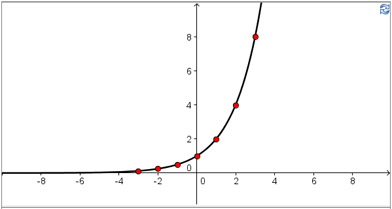
x-intercepts none y-intercepts 1 End Behaviour 
curve extends from quadrant II to quadrant I Behaviour from Quadrant II
to Quadrant I
(Increasing or Decreasing)increasing Domain {x|x ∈ R} Range {y|y > 0, y ∈ R} - How do the x- and y-intercepts for each of the exponential functions compare?
- Compare the end behaviour and whether the graph is increasing or decreasing from quadrant II to quadrant I for exponential functions of the form y = bx when b > 1 and when 0 < b < 1.
- Compare the domain and range for all four exponential functions.
![]() Save your responses in your course folder.
Save your responses in your course folder.
Share 2
With a partner or group, discuss the following question based on your graphs created in Try This 2. Describe any patterns you noticed in the graphs or table of values for the function y = bx, b > 0, b ≠ 1, when the b-value is changed.