Lesson 1
1. Lesson 1
1.6. Explore 2
Module 7: Exponents and Logarithms
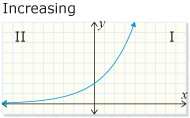
In Try This 2 you may have noticed that when b is greater than 1 in the formula y = bx, the graph increases from quadrant II to quadrant I. This graph describes exponential growth.
From PRINCIPLES OF MATHEMATICS 12 by Canavan-McGrath et al. Copyright Nelson Education Ltd. Reprinted with permission.
This graph shows y = bx, b > 1.
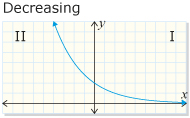
When b is greater than 0 but less than 1, the graph decreases from quadrant II to quadrant I. This graph describes exponential decay.
From PRINCIPLES OF MATHEMATICS 12 by Canavan-McGrath et al. Copyright Nelson Education Ltd. Reprinted with permission.
This graph shows y = bx, 0 < b < 1.
The characteristics of all exponential functions of the form y = bx, b > 0, b ≠ 1 are as follows:
- The domain is {x|x ∈ R}.
- The range is {y|y > 0, y ∈ R}.
- There is no x-intercept.
- The y-intercept is 1.
- The end behaviour is that the graph goes from quadrant II to quadrant I.
Self-Check 1
Complete questions 1 and 2 on page 337 of your textbook. Answer