Lesson 1
Completion requirements
Created by IMSreader
1. Lesson 1
1.7. Explore 3
Module 7: Exponents and Logarithms
In Try This 3 you will explore how the graph of an exponential function is changed when the parameters of y = a(b)x (where a > 0, b > 0, and b ≠ 1) are altered.
Try This 3
Open the “Exponential Functions—Activity A” tool.
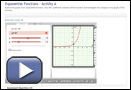
Screenshot reprinted with permission of ExploreLearning.
- Use the sliders and change the a- and b-values to produce the graphs of different exponential functions. Complete a table like the following.
Value of a
1 3
2 4 Value of b 2 2 0.7 0.5 Function (y = bx) y = 2x Sketch 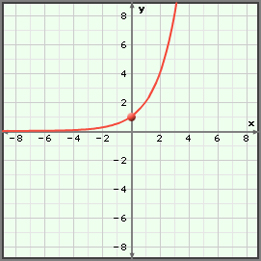
Screenshot reprinted with permission of ExploreLearning.
x-intercepts none y-intercepts 1 End Behaviour curve extends from quadrant II to quadrant I Behaviour from Quadrant II
to Quadrant I
(Increasing or Decreasing)increasing Domain {x|x ∈ R} Range {y|y > 0, y ∈ R} - Given the equation of an exponential function in the form y = a(b)x where a > 0, b > 0, and b ≠ 1, explain how you can determine
- the y-intercept
- if the function is increasing or decreasing
![]() Save your responses in your course folder.
Save your responses in your course folder.