Lesson 1
1. Lesson 1
1.8. Explore 4
Module 7: Exponents and Logarithms
In Try This 3 you may have found the relationships between the a and b parameters of the function and the corresponding graph of exponential functions in the form y = a(b)x, where a > 0, b > 0, and b ≠ 1. These relationships are shown in the following table.
Parameter |
Effect on Graph |
| a | equal to y-intercept |
| b | If b > 1, the function is increasing. If 0 < b < 1, the function is decreasing. |
Consider the function y = 2(5)x, where a = 2 and b = 5. You know this will be an increasing function because b > 1.
Confirm that there is no x-intercept:
- Let y = 0; therefore, 0 = 2(5)x. From this, determine an x-value that will result in the function becoming 0.
- There is no value of x that results in the function becoming 0; therefore, there is no x-intercept.
The y-intercept is the a-value; confirm that this is the case:
- Let x = 0; therefore,

- The y-intercept is 2, which is the a-value.
Because the b-value is greater than 1, this function’s end behaviour is increasing from quadrant II to quadrant I.
The domain of this function is {x|x ∈ R}, which means that any value of x can be used. This makes sense as the graph goes from quadrant II to quadrant I, which encompasses all of the x-axis.
The range of this function is {y > 0, y ∈ R}, which means that only positive values of y can be used. This makes sense as the function is above the x-axis and does not touch the x-axis.
You can verify these characteristics by graphing the exponential function y = 2(5)x.
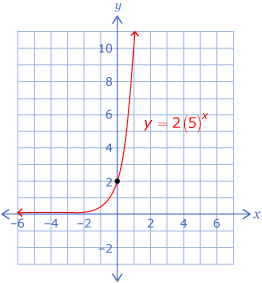
From the graph, note the following:
- The graph never touches the x-axis; therefore, there is no x-intercept.
- The y-intercept is 2.
- The end behaviour is from quadrant II to quadrant I; the graph is increasing.
- The domain is {x|x ∈ R}.
- The range is {y|y > 0, y ∈ R}.