Lesson 4
Completion requirements
Created by IMSreader
1. Lesson 4
1.3. Explore 2
Module 7: Exponents and Logarithms
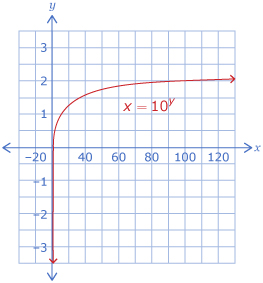
In Try This 2 you noticed that the graph of y = log10 x is identical to the graph of x = 10y; therefore, the characteristics of the two graphs are the same.
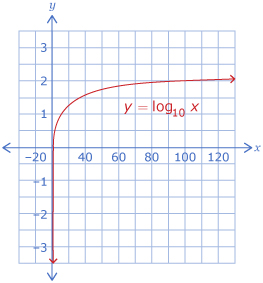
| Characteristics | y = log10 x |
| Domain | x > 0 |
| Range | y ∈ R |
| x-intercept | The x-intercept value is 1. |
| y-intercept | none |
| End behaviour | from quadrant IV to quadrant I |
Now that you are familiar with the characteristics of the graph of y = log10 x, you will examine how a change to the parameter a affects the graph of y = a log10 x, where a is a real number.
Try This 3
Open the Logarithmic Functions applet.
- Investigate the effects of a on the graph of y = a log10 x by moving the slider. Record your results in a table similar to the following.
Characteristics a < 0 a > 0 Value of x-intercept Value of y-intercept Domain Range End Behaviour -
- How could knowing the a-value help you predict the characteristics of the graph of y = a log10 x?
- Based on your answer to 2.a., predict what the graph of y = −8 log10 x will look like. Check your prediction using the Logarithmic Functions applet.