Lesson 4
Completion requirements
Created by IMSreader
1. Lesson 4
1.4. Explore 3
Module 7: Exponents and Logarithms
In Try This 3 you may have determined that the a-value affected the end behaviour. When a is positive, the graph is increasing. The graph starts in quadrant IV and ends in quadrant I. When a is negative, the graph is decreasing. The graph starts in quadrant I and ends in quadrant IV.
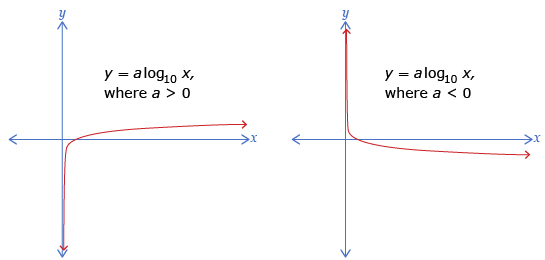
The other characteristics of the graph do not depend on the sign of a, as shown in the following table:
| Characteristics | a < 0 | a > 0 |
| Value of x-intercept | 1 | 1 |
| Value of y-intercept | none | none |
| Domain | x > 0 | x > 0 |
| Range | y ∈ R | y ∈ R |
| End Behaviour | from quadrant IV to quadrant I | from quadrant I to quadrant IV |
Self-Check 1
![]()