Lesson 4
Completion requirements
Created by IMSreader
1. Lesson 4
1.5. Explore 4
Module 7: Exponents and Logarithms
In Lesson 3 you worked with the pH formula to find the hydrogen ion concentration and the pH value. In Try This 4 you will use a graph of the pH and hydrogen ion concentration to solve problems.
Try This 4
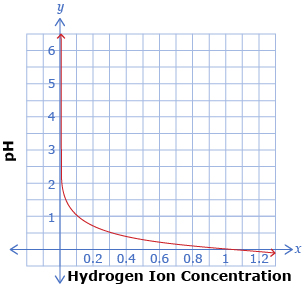
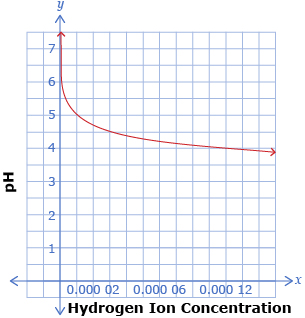
The following two graphs show the relationship pH = −log x, where x is the hydrogen ion concentration of a solution. The two graphs show the same function, but with different x-axis scales.
-
Use the graphs to determine the pH when the hydrogen ion concentration is

iStockphoto/Thinkstock
- 0.4
- 0.000 04
-
- For what hydrogen ion concentrations is each graph useful?
- For what pH range is each graph useful?
-
- Describe an advantage and a disadvantage to using a graph to represent a logarithmic function such as the pH graphs shown.
- Describe an advantage and a disadvantage to using an equation such as pH = −log x to represent a logarithmic function.
![]() Save your responses in your course folder.
Save your responses in your course folder.