Lesson 4
Completion requirements
Created by IMSreader
1. Lesson 4
1.8. Lesson 4 Summary
Module 7: Exponents and Logarithms
Lesson 4 Summary
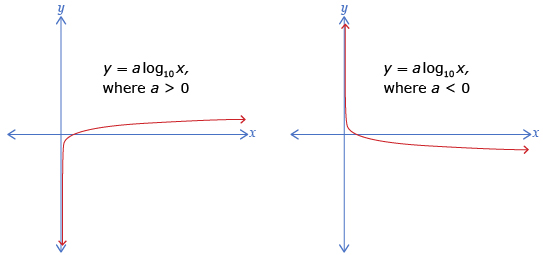
Like the other functions you have seen, logarithmic functions can be graphed. The graph of a logarithmic function in the form y = a log x has the following characteristics:
| x-intercept | 1 |
| Number of y-intercepts | 0 |
| End Behaviour | The curve extends from quadrant IV to quadrant I when a > 0 and from quadrant I to quadrant IV when a < 0. |
| Domain | x > 0 |
| Range | y ∈ R |
Adapted from PRINCIPLES OF MATHEMATICS 12 by Canavan-McGrath et al. Copyright Nelson Education Ltd. Reprinted with permission.
In the next lesson you will explore how logarithmic expressions can be manipulated using the laws of logarithms.