Module 1
1. Module 1
1.31. Page 6
Module 1—The Nervous System
 Try This
TR 6. Choose one of the following activities.
Do questions 5 and 7 on page 418 of the textbook.
OR
Watch the segment called “Interpretation” in the video “The Eye: Vision and Perception: A Whole World to See,” which addresses how the brain is involved in interpretation of vision stimuli.
You may be required to enter a username and password to access the video. Contact your teacher for this information.
 Module 1: Lesson 5 Assignment
As you worked through this lesson, you learned about the different structures of the eye and their functions in facilitating vision. You were also introduced to some disorders that are the result of one or more of these structures malfunctioning.
Retrieve the copy of the Module 1: Lesson 5 Assignment that you saved to your computer earlier in this lesson. Complete Part 2—Table of Vision Defects and Disorders. Recall that you have already studied some of these vision disorders. Make sure you add these to your table. Save your completed assignment in your course folder. You will receive instructions about when to submit your assignment to your teacher later in this lesson.
 Self-Check
To ensure that you have mastered the concepts of this lesson, do this Self-Check that includes a numerical-response question and a closed written-response question. This is an excellent opportunity to practise for the types of questions that will be presented on the Diploma Exam.
Use the following information to answer question SC 2.
Visual Interpretation
The brain integrates visual information from both eyes. Some of the steps in the visual pathway are shown below. Note that these steps are NOT in the correct order and that NOT all steps are part of the visual pathway.
|
SC 2. In the four spaces below, record the assigned numbers of the four steps that are part of the visual pathway. Record the steps in the correct order in which they occur during the visual pathway.
____ ____ ____ ____
SC 3. There are two main types of light-sensitive cells (called X and Y in this question) in the healthy human retina, but they are not evenly distributed. An investigation of the distribution of sensory cell types X and Y across an area of the retina (shown as PQ on the diagram below) was developed.
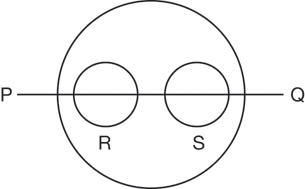
The relative numbers of cell types X and Y were more or less constant, except in positions R and S. Using relative numbers, the following graph indicates the relative frequency of sensory cell type X along the axis PQ.
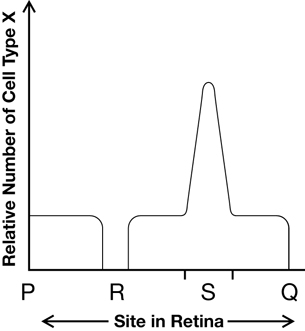
- Identify cell type X.
- Identify cell type Y.
- What structure is represented by region R?
- What structure is represented by region S?
- Copy the graph above and clearly superimpose a curve to indicate the relative frequency of cell type Y along the axis PQ.
SC 4. The diagram below represents the different states of the iris in bright and in dim light.
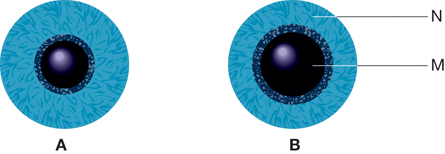
- What structures are represented by M and N?
- Briefly explain what causes the iris of eye B to have a different appearance than that of
eye A.
Self-Check Answers
SC 2. 6, 1, 4, 3
SC 3. a. i. Cell Type X represents the cones.
ii. Cell Type Y represents the rods.
iii. Region R represents the blind spot.
iv. Region S represents the fovea centralis.
b. Cell Type Y would be constant with a sharp dip in region R and S.
SC 4. i. M and N represent the circular muscle of the iris or, more specifically, M represents the circular muscle and N represents the radial muscle.
ii. In bright light, represented by A, the parasympathetic nervous system (a division of the autonomic nervous system) stimulates the contraction of the circular muscle (M) of the iris, and allows the relaxation of radial muscle (N). This reduces the pupil diameter and allows less light to enter the eyeball and strike the retina.
In dim light, represented by B, the sympathetic nervous system (a division of the autonomic nervous system) stimulates the contraction of the radial muscle (N) of the iris and allows the relaxation of circular muscle (M). This increases the pupil diameter, which allows more light to enter the eyeball and strike the retina.