Module 3 Summary
Completion requirements
Created by IMSreader
1. Module 3 Summary
Module 3 Summary

Design Pics/Thinkstock
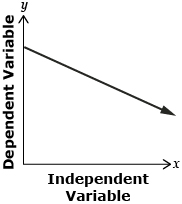
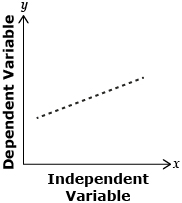
Linear relations can be expressed in many ways, as shown in the table.
As a Graph |
|
||||
As an Equation |
y = mx + b, where m is the slope, b is the y-intercept, and (x, y) represents any point on the line. | ||||
As a Table of Values |
|
||||
Expressed in Words |
A car travels at 90 km/h. For every hour of travel the car is 90 km farther from its starting point. |