Lesson 2
1. Lesson 2
1.8. Lesson 2 Summary
Module 4: Statistical Reasoning
Lesson 2 Summary
Data can be organized, presented, and summarized in a variety of ways. How data is displayed or organized affects what inferences or conclusions can be drawn from the data. Summary statistics, such as measures of central tendency and/or measures of dispersion, can meaningfully describe a set of data.
When interpreting data, sometimes more than just the mean, median, and mode are required. Measures of dispersion, like range and standard deviation, are useful because they can be used to determine how scattered or clustered a data set is.
iStockphoto/Thinkstock
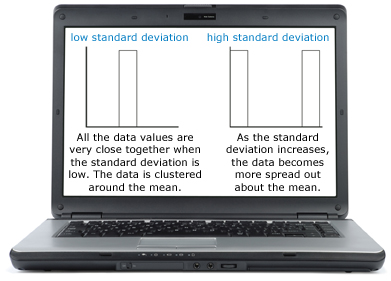
When the standard deviation is low and the data is clustered around the mean, the process used to generate the data is considered more consistent than a process that generated data with a high standard deviation (data more spread out about the mean).
This information is useful in comparing data as well as in interpreting the data to make decisions or solve problems.
In Lesson 3 you will continue to look at how standard deviation can be used to help make decisions or solve problems.