Lesson 3
1. Lesson 3
1.2. Discover 2
Module 4: Statistical Reasoning
Try This 1
Use the interactive applet “Normal Distribution” to investigate how increasing the number of trials affects the shape of a frequency distribution. As you progress through this applet, you will also change the standard deviation to see how changing the standard deviation changes the shape of the graph.
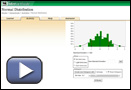
© Shodor Education Foundation Inc.
The graph (i.e., the black, bell-shaped curve) in the applet shows a normal curve. The mean is indicated by a blue line, and the standard deviation is indicated by a red line on either side of the mean. You will notice that the frequency is given on the y-axis. Your textbook replaces these values with the word frequency. You will find that it is much easier to sketch a normal curve if you put the frequency scale on the y-axis.
Use the following instructions to experiment with different numbers of trials and standard deviations.
Step 1: Set the bin size to 0.2 by moving the slider to the appropriate position.
Step 2: Enter a standard deviation of 1 into the “New Standard Deviation” box and select “Set.”
Step 3: In the “Histogram” section, use the drop-down menu and select 100 trials. Then choose the “Create new Histogram with” button. Make sure the “Draw Histogram” box is checked. You should click the button at least five times. Notice how the shape of the histogram changes each time.
Step 4: Repeat step 3 with 500, 1000, 2000, 5000, and 10 000 trials. Answer the following question, and place your answer in your course folder.
How does the shape of the graph change as the number of trials is increased?
Step 5: Repeat steps 3 and 4 with standard deviations of 0.5 and 1.25. Remember to click “Set” after you enter the new standard deviation. Answer the following questions, and place your answers in your course folder.
- How does the shape of the graph change when the standard deviation is decreased (e.g., from 1 to 0.5)?
- How does the shape of the graph change when the standard deviation is increased (e.g., from 0.5 to 1.25)?
Step 6: You can drag the black dots on the standard deviation lines or enter new standard deviations to experiment with the shape of the graph with other standard deviations. Note that the maximum standard deviation you can enter is 1.25 and the minimum standard deviation is 0.41.