Lesson 3
1. Lesson 3
1.3. Explore
Module 4: Statistical Reasoning
Explore
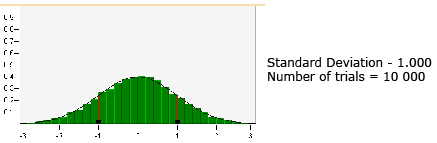
It is important to realize that there is no perfect normal distribution. Normal distribution is a mathematical ideal. However, you can be more confident that data approximates a normal distribution with the more data you have or the more trials that are performed.
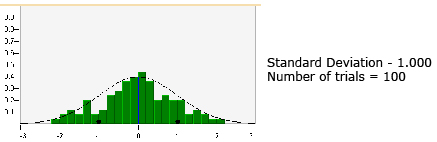
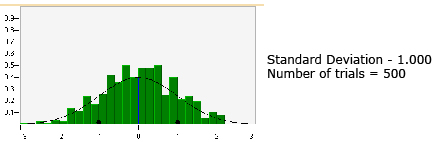
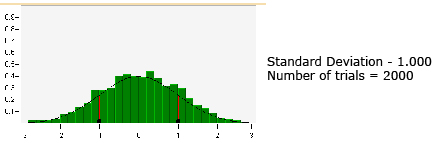
Did you notice in the “Normal Distribution” applet in Try This 1 how the histograms approximated the normal distribution (i.e., approached the normal curve) as the number of trials increased?
© Shodor Education Foundation Inc.
© Shodor Education Foundation Inc.
© Shodor Education Foundation Inc.
© Shodor Education Foundation Inc.
As the number of trials increases, the shape of the histogram becomes more bell-like and symmetrical, where approximately half the data will be above the mean and half the data will be below the mean. In other words, the data will be symmetrical about the mean or be normally distributed.
The mean describes the position of the normal distribution on the x-axis. The standard deviation describes the width of the normal distribution.
In Try This 1, you also experimented with how standard deviation affects the shape of a normal curve. The spread of the normal curve is controlled by the standard deviation. The larger the standard deviation, the more spread out the data—the normal curve has a shorter peak and is wider. A smaller standard deviation results in a normal curve that is narrower and has a taller peak.
In the first applet, you looked at how changing the sample size and standard deviation affected the curve. Open the interactive applet Standard Deviation and the Normal Curve, and change the values of the mean and standard deviation to investigate how these changes affect the shape and/or position of the normal curve.
![]()
The symbol μ (read as “mu”) is used to represent the mean for an entire population. The symbol ![]() is used to represent the mean for a sample of a population.
is used to represent the mean for a sample of a population.
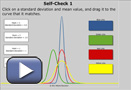
Self-Check 1
Complete the activity titled Self-Check 1, an interactive matching activity.